
Spatial Portals and Anomalous Manifestations in our Airspace
Dr. Wilbur G Allen, PhD 2020
This data is built on AVID DNxHD 200 workflow. Ultra HD Video standards
AVID Media Composer 2021.6 64 Bit Digital Editing Mastering, Motion Picture production.

Boris Fx BCC 2019
![]()
![]() 2019
2019

The images on this page are active links.
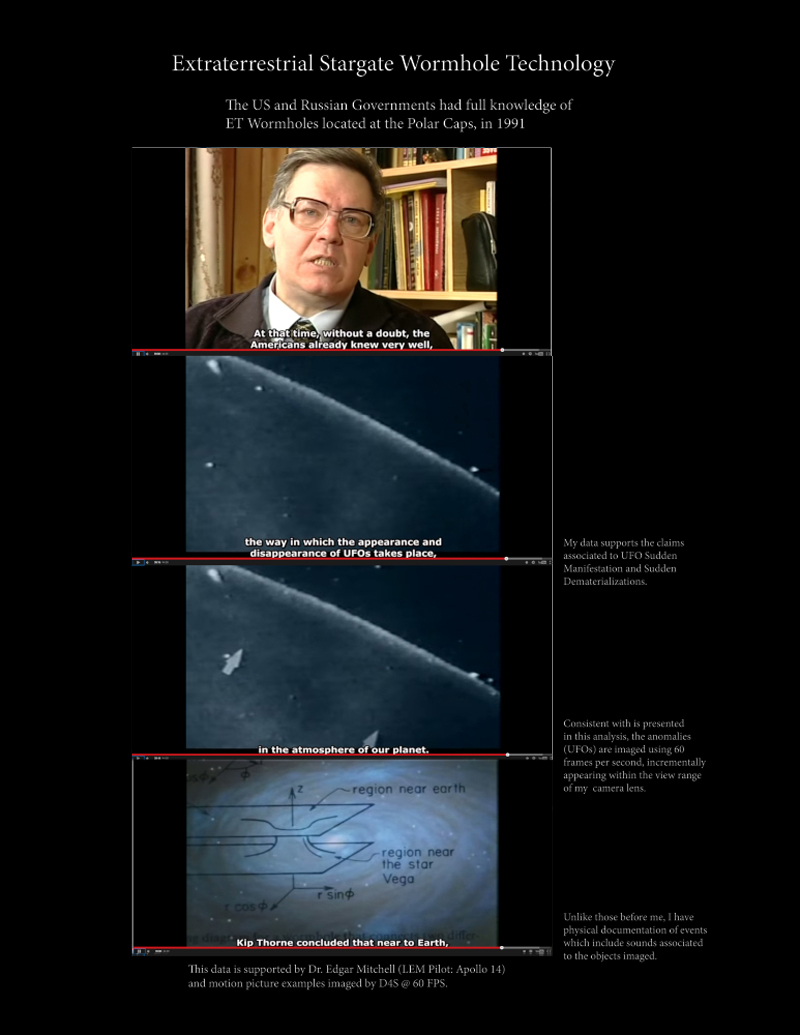
Onboard MIR scientist discovered and witnessed the ways in which anomalous objects were entering and exiting
our Airspace and Outer Atmosphere. "The way in which the appearance and disappearance of the UFOs taking
place in the atmosphere of our planet" * MIR Space Station 1990 * This study illustrates the realities associated
to MIR's Spatial Portal Research, as realities and events within our Airspace.
![]()
This research is built upon empirical evidence. The materials do not require dialog. Talking, especially when the
realities are unknown, muddles the equation (conjecture). I will not say that which I do not know. The bulk of the data
is current. Data is accumulated daily.
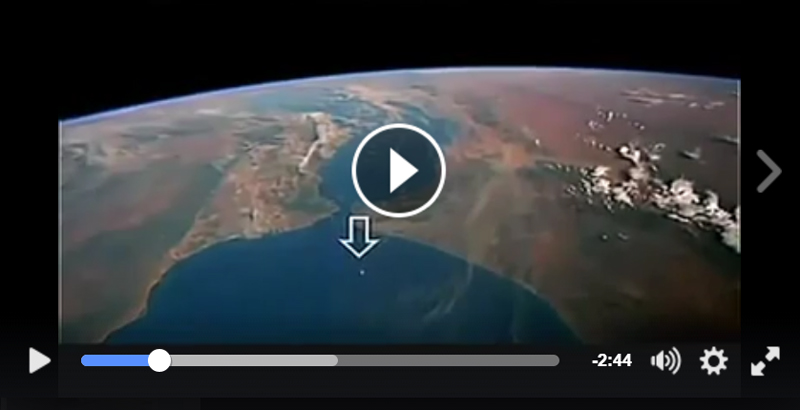
"The Real Men In Black", a Russian Documentary Film (English subtitles)
1990 :At this time, without a doubt, the Americans already knew very well, the way in which the appearance
and disappearance of the UFOs taking place in the atmosphere of our planet (1990). Onboard MIR Space
station, scientist witnessed and documented objects which appeared and disappeared in and out of our
outer atmosphere. Crews onboard MIR documented unusual manifestations in Space, using limited Digital
imaging technology 480-620P 550nm IR.
The Russians were suspecting of the American scientists onboard MIR. They knew America was withholding
data relative to the "appearances and disappearances" of these objects. This data supports Admiral Richard
Byrd's assessment of anomalies encountered by Operation Highjump. Based on evidence presented, activities
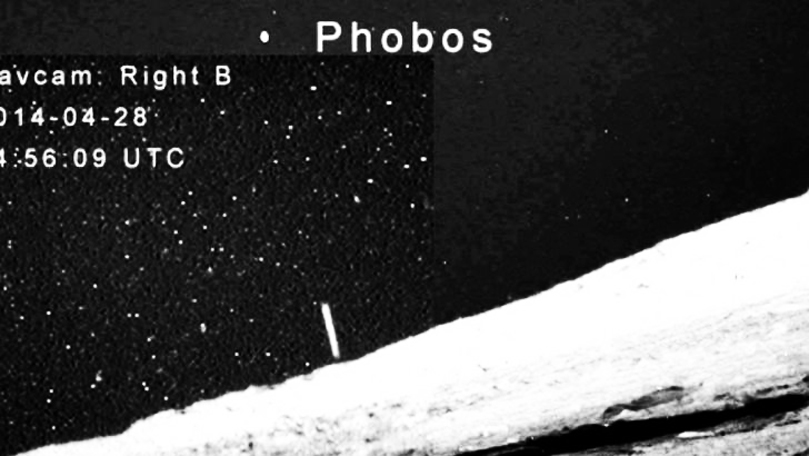
documented by my systems suggests the anomalies documented by MIR and Phobos 2 are prevalent within
our airspace.
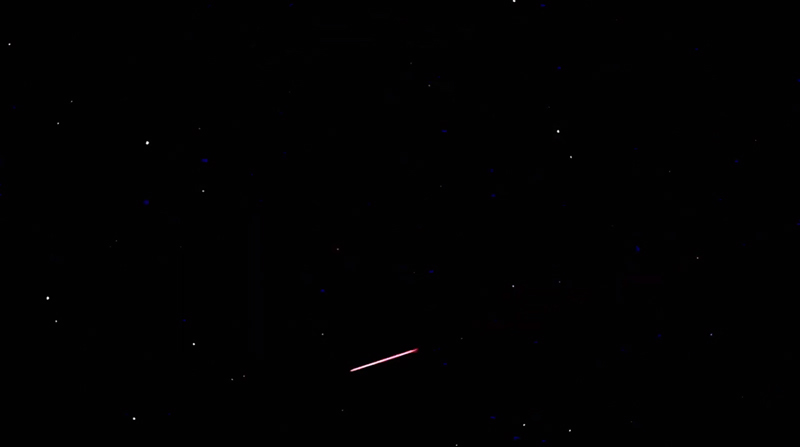
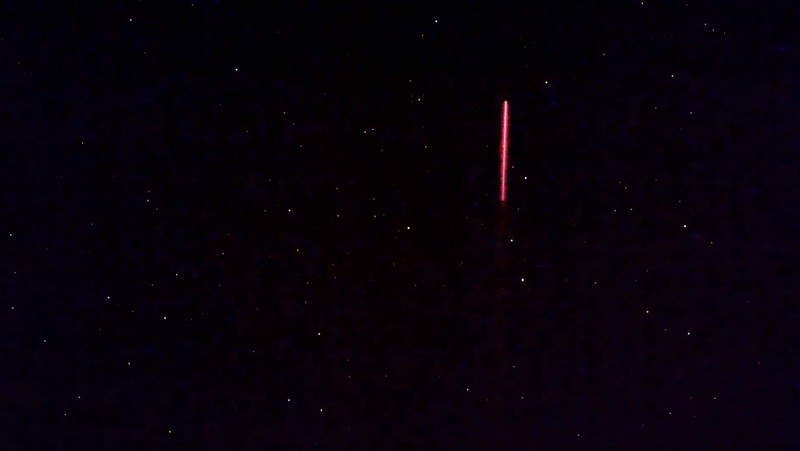
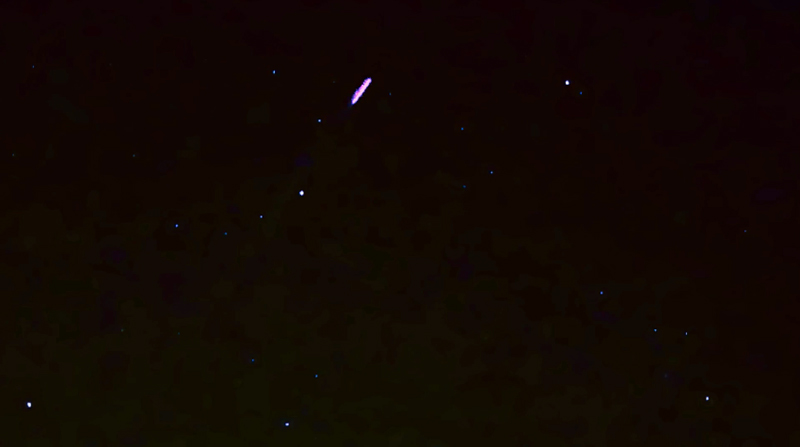
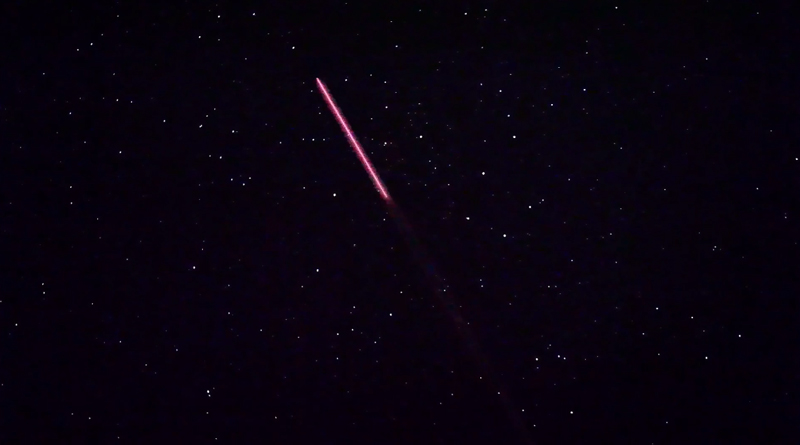
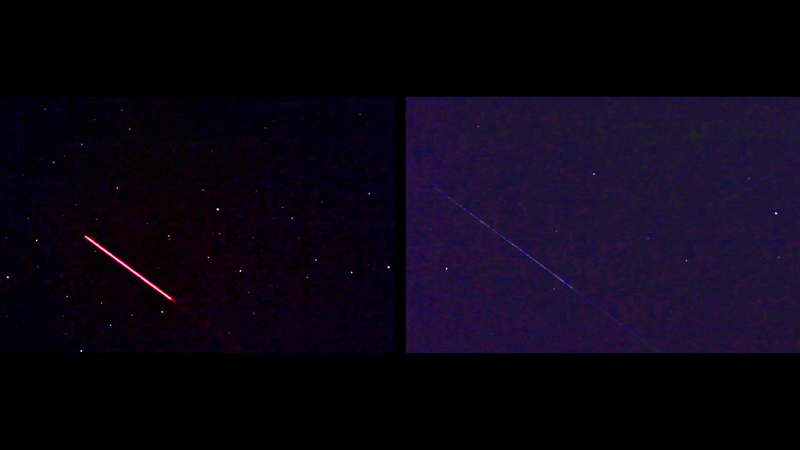
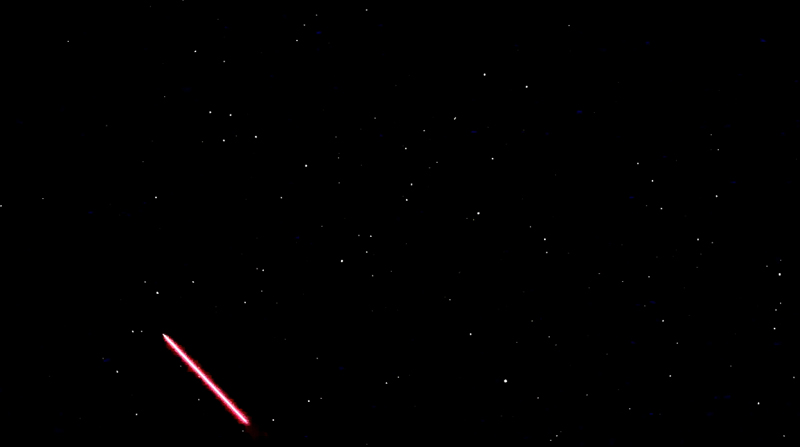
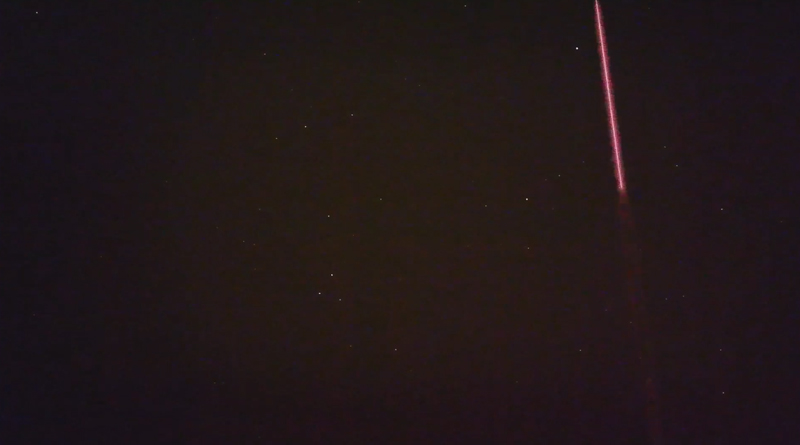
5-01-2020 UFO Red Band of Light Portal Entry Hyperstar 470nm IR RGBKL Analysis
The conclusions based on the evidence recorded onboard MIR, were Aliens are using Spatial Portals/Wormholes
however Self Generated Portals. Self generated portals are independent from magnetic field associations. These
portals can appear anywhere regardless of field strengths and deviations. In the above example, the Red streak
of Light "appears" into the airspace, however does not fly into it. The analysis pool is far from the regions in which
this is said to exist (Bermuda and Alaska Triangles). The Russians illustrated the lack of scientific transparency
onboard MIR. To this day, things have not changed. (Presenting past evidence is essential in discussions).
In the 1990's 480P - 620P were imaging standards. Digital CCD Spatial imaging technology (IR) was monochromatic,
though color video imaging was developed during Apollo, was limited in resolution (ISO 400- 1600). The files showed
anomalous movements in Space, which were not part of the known Space Program . That anomalous movement was
from objects of unknown origins. The events/anomalies were documented along the North and South Magnetic Poles.
They're now referred to as the Tic Tac UFO's encountered by the USS Nimitz. Note the streak of light 53 seconds into
this video.
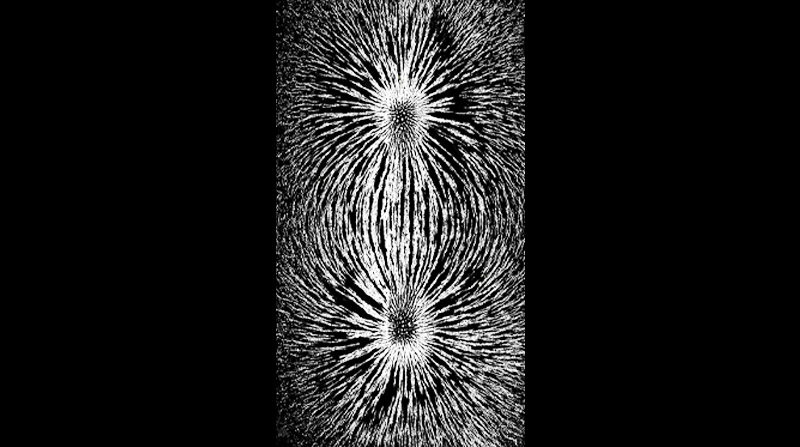
(2 Spinning Magnets North and South Poles).
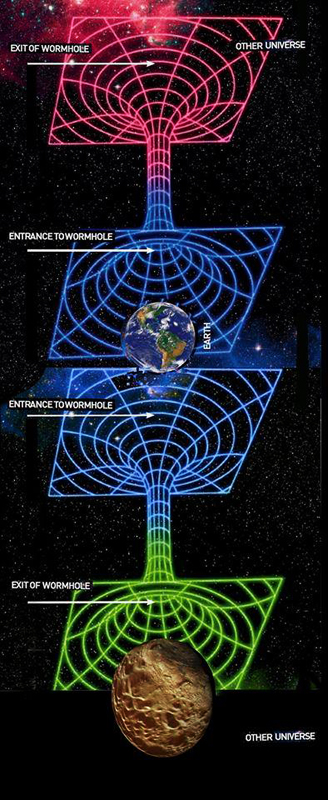
Each Magnetic Pole has an associated Wormhole. It was assumed that both the North and South Pole Wormholes
have different Spatial beginnings and endpoints. Each rotating magnetic Pole is generating a rotating magnetic
"Mushroom". When magnetic fields rotate around tightly wound copper wire, electricity is generated. In the case of
Earth and all celestial bodies that rotate along North and South magnetic poles, Spatial wormholes will exist as a
byproduct of that planets rotating magnetic fields. If we place a large Plus sign on top of this illustration, the
horizontal and vertical lines locate the regions in which the magnetic fields are inconsistent. Equator Center
/North and South. , North and South poles (centered top/bottom side) +.
(2 Spinning Magnets South and North Poles)
Each Magnetic Pole has an associated Wormhole.
The Wormholes discovered onboard MIR by US and Russian scientist, were located at the Geographic North
and South Poles. My research focused on events located near the North Pole Wormhole. Understanding Earths
magnetic fields, we can illustrate field variance associated to each magnetic pole. Though discovered in 1990, it
is my belief that these Wormholes existed far longer than we can imagine.
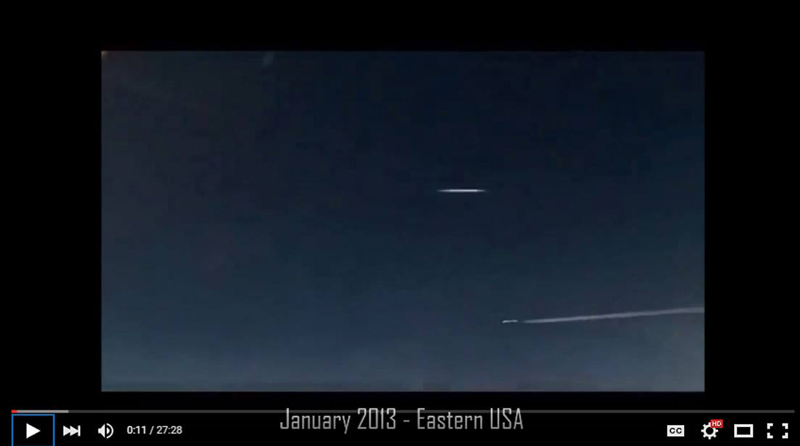
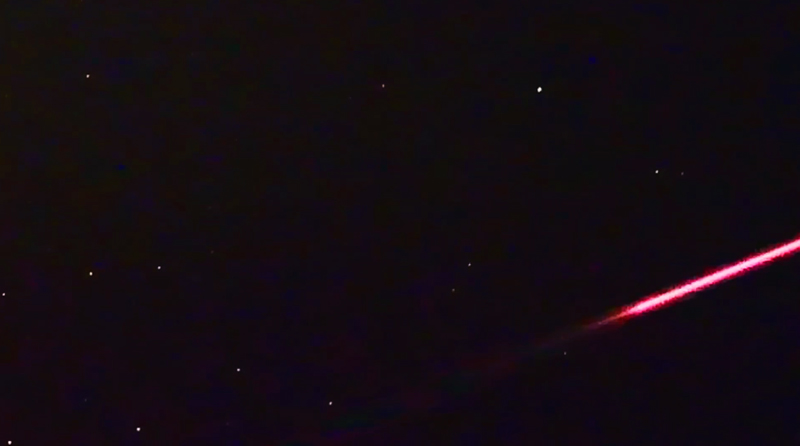
Supportive Evidence from a second party source; a child onboard an aircraft filming out his seat window* Its a day
time example and filmed with a cellphone camera. Though more than likely taken with an i-Phone (phone of choice
for children), the sample provides sufficient proof, and validates evidence taken with advanced camera systems
Nikon (D4/D4s/D5). My samples are all primarily 60 frames per second. Prolonged exposures are impossible at
high frame rates. Because these samples are 60 FPS, the minimal shutter speed that can be used is 1/60th of a
second. Due to the high ISO used to record the events, I am able to increase my shutter speeds to 1/250th of a
second (before video noise). Understanding High ISO means more granular distortion (noise), requiring VNR
(Video Noise Reduction). For this I use Boris Fx

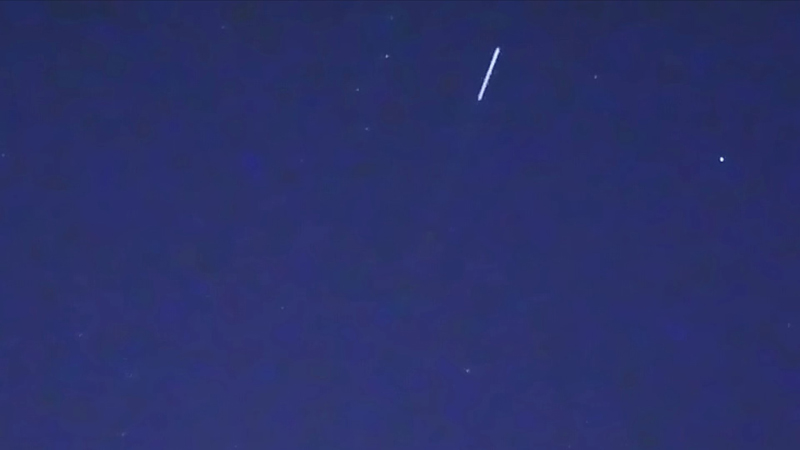
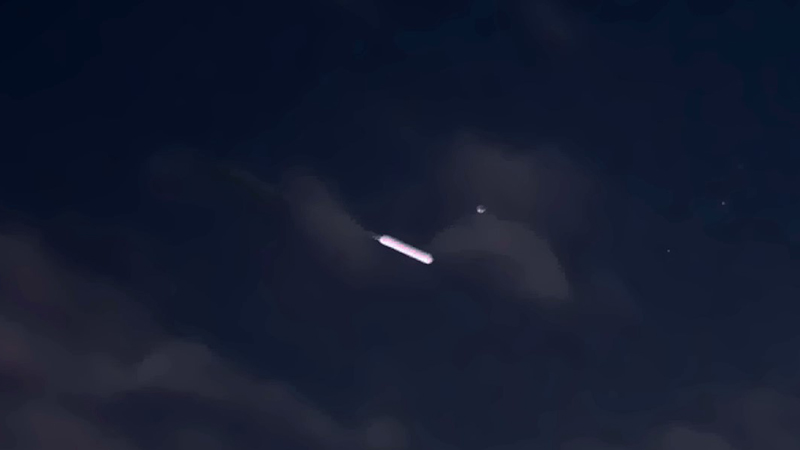
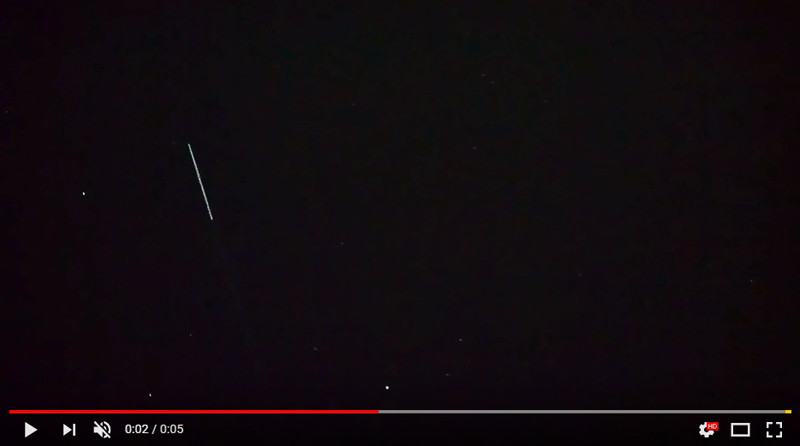
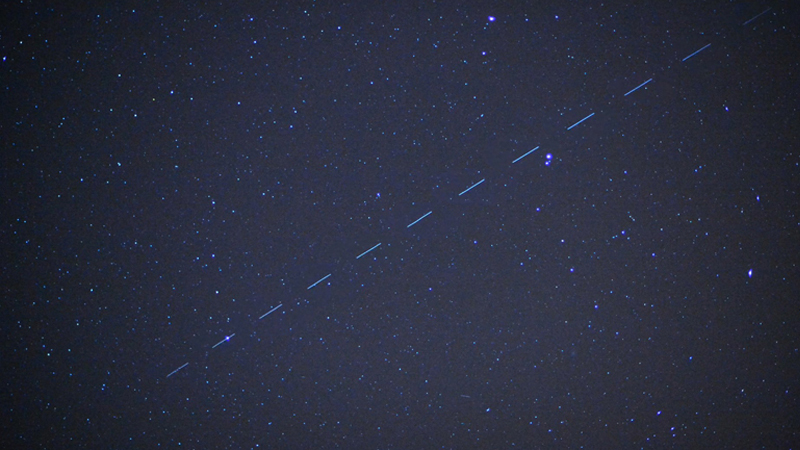
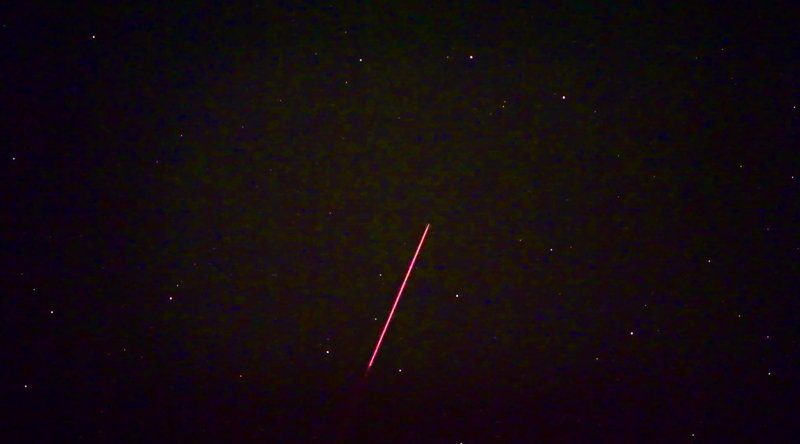
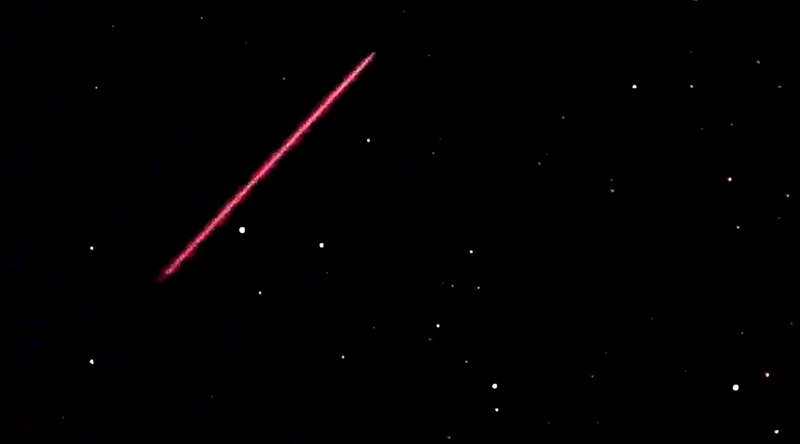
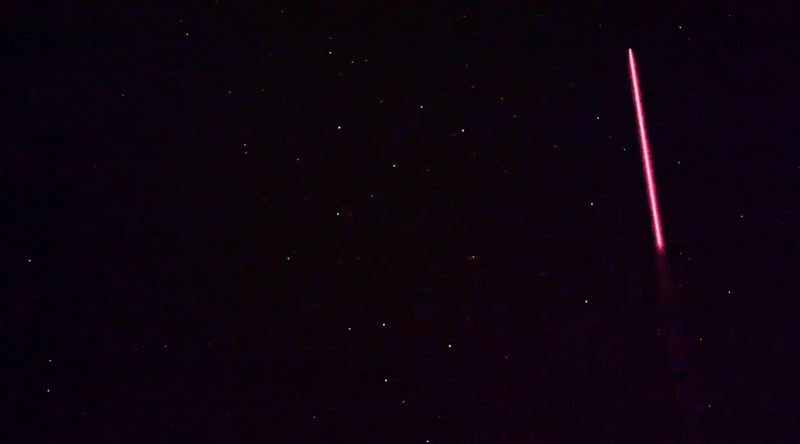
11-11- 2019 Portugal Band of Light UFO Slow Flyby Analysis. This is a Facebook submission. The sample taken in
Portugal using a ground based cellphone. It could not be the result of camera video frame rate and shutter speed.
The video shows clearly a streak of light moving at a very slow velocity.
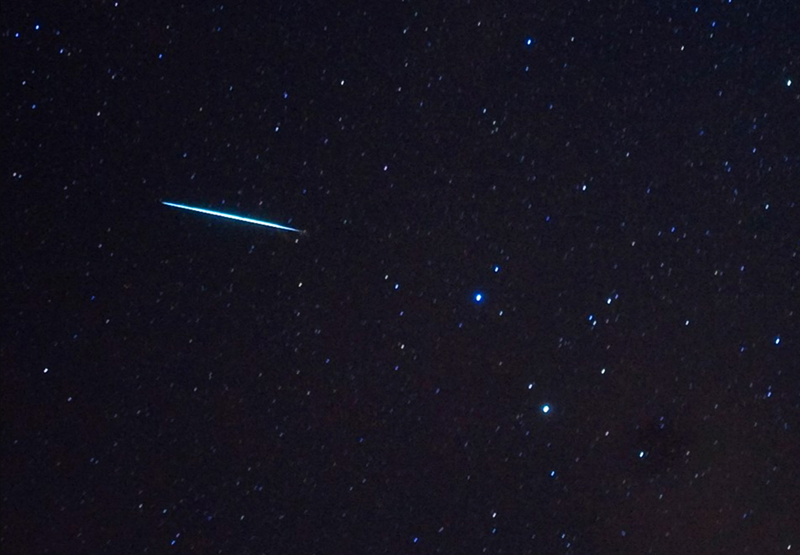
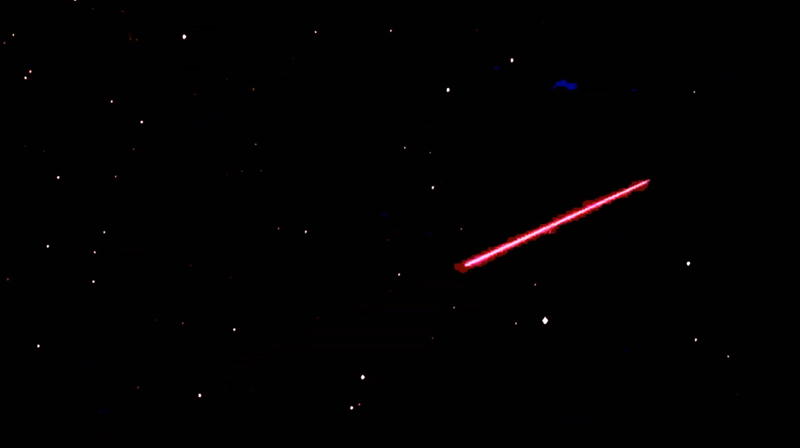
10-13-2016 Click on image for video. Nikon D5. Several files that are exactly the same, all within
the same region of space (FPOA). 60fps using 1/250th of a second shutter speed (High Speed
video). The streaks could not be the result of blurring based on the frame rate and shutter speed.
11-26-2016 UFO Cylinder Band of Light SM SDM Analysis. In some cases such as this, it's obvious
this object is within close proximity, however an erie match to the anomaly which destroyed the
Russian Phobos 2. This forensic
match is imaged in P-53 Restricted Airspace (The White House). This is clearly associated with
a Spatial Portal. The anomaly incrementally materializes into the airspace. D5 Nikon 24mm f/1.4
![]()
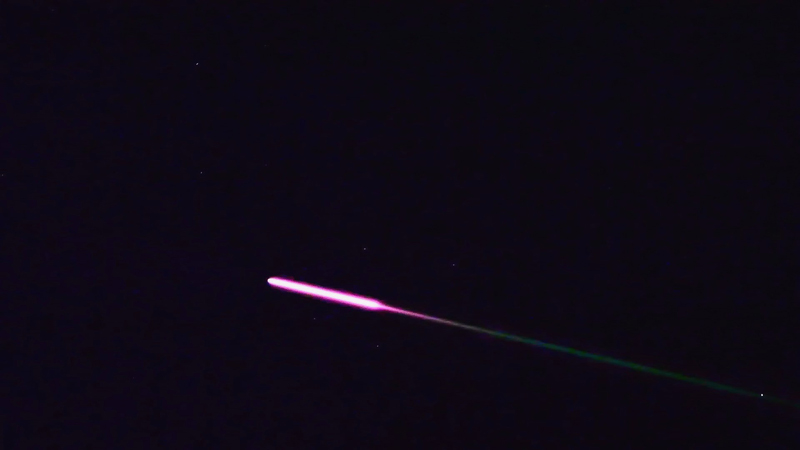
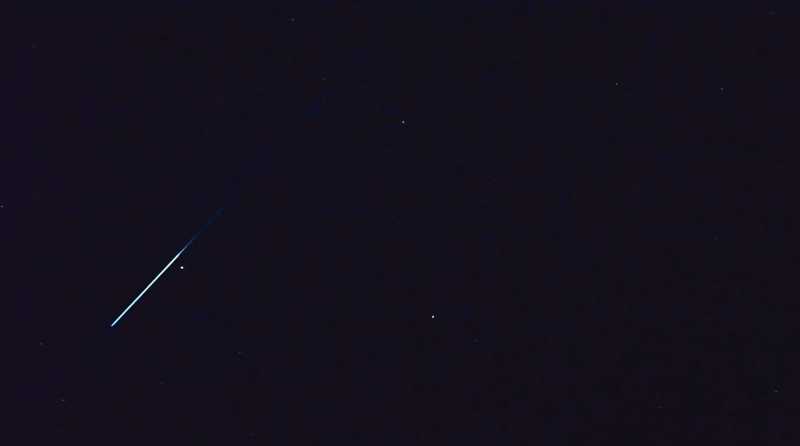
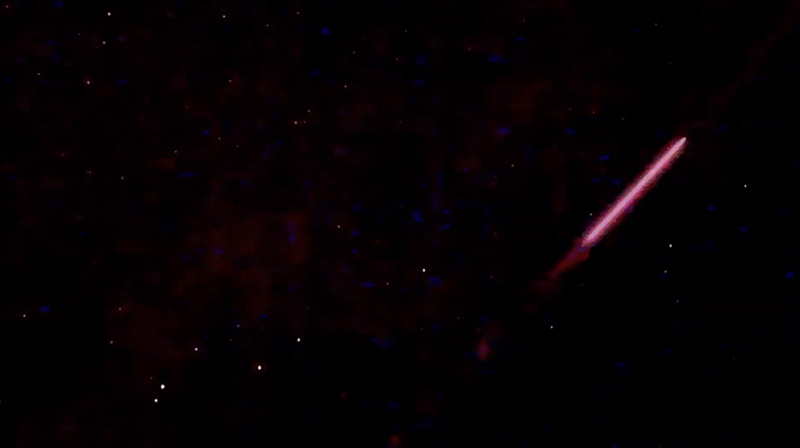
8-13-2014 UFO Cylinder Band of Light WARP Flyby Sound Tracker RGBKL Analysis. 24mm 60fps using 1/250th of
a second shutter speed. Is this a blur or is it a straight white uniform line with a green tail? @ 24 mm wide angle, motion
blurring @ 60fps using 1/250th of a second shutter speed is a physical impossibility (unless the objects are moving at
hyper velocities.
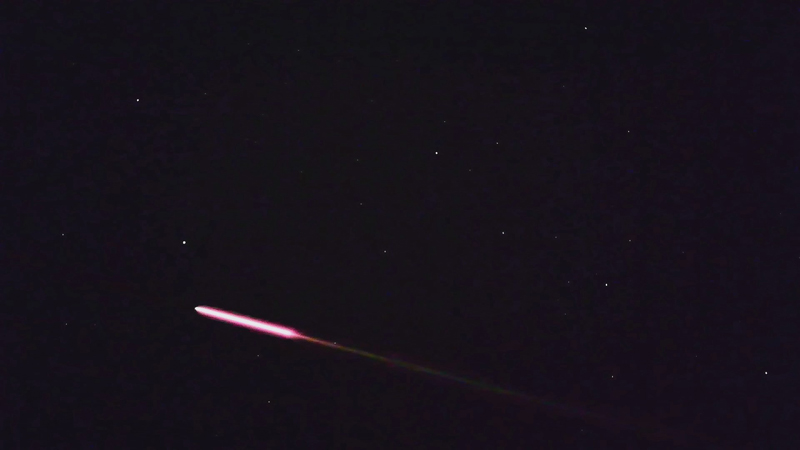
8-03-2015 UFO Cylinder Green Beam WARP Sound Analysis. The sound elements generally
associated the the UFO.
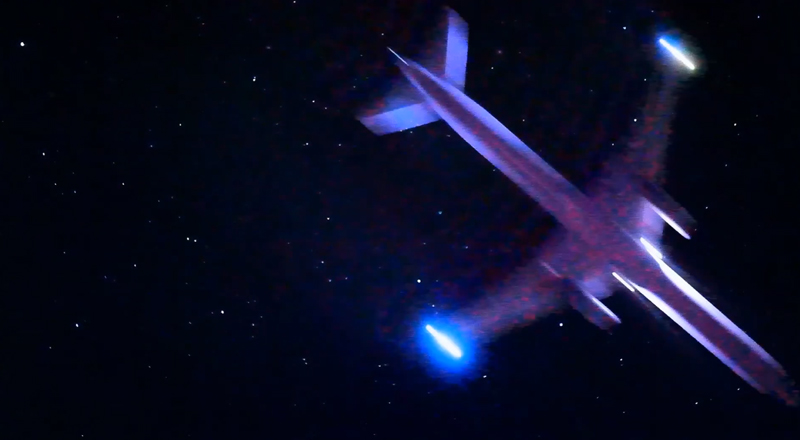
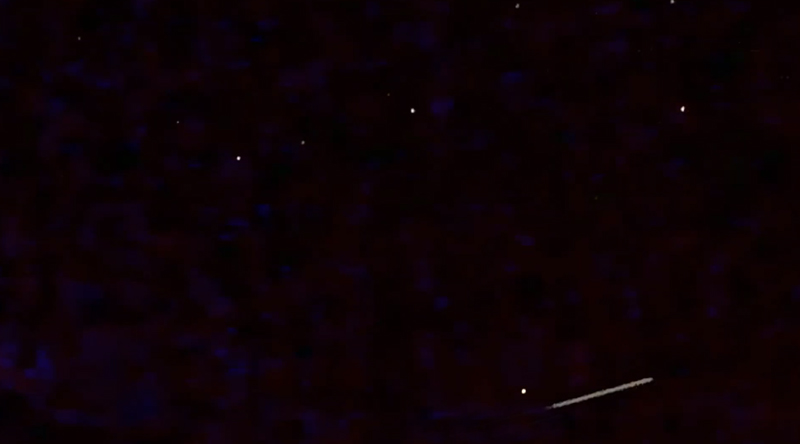
8-29-2020 Jet Flyby SuperBlue IR. A required example for lens definitions. Filmed in obvious darkness @ 60fps using
1/100th of a second shutter speed. This aircraft is below the focus threshold. If this event was filmed with an aircraft 25
thousand feet higher, it would be in 100% focus with less motion distortion. The closer an object and event is to the lens
the more likely motion blurring will occurs regardless of frame rate and shutter speed. I'm looking into darkness in FCIR
(Full Color Infrared). These conditions and samples maybe invisible to humans. The jet is out of focus.
![]()
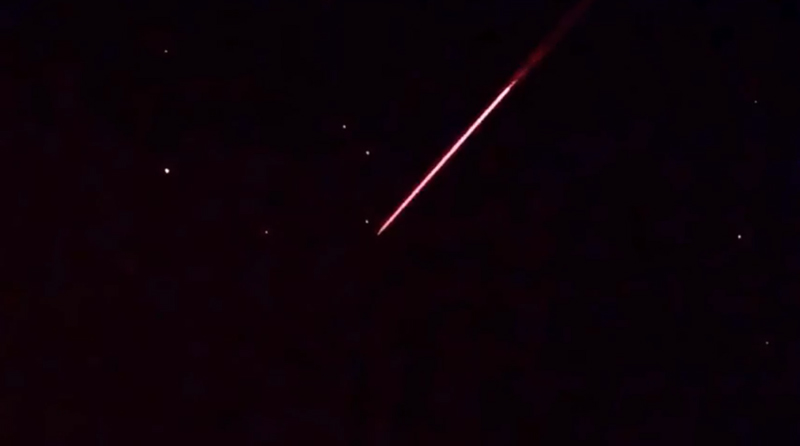
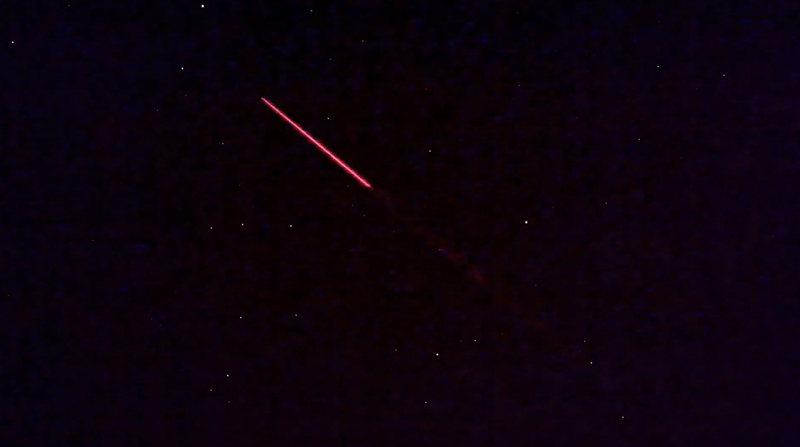
1-17-2020 UFO Red Band of Light 3 Portal Entry Hyperstar 470nm IR RGBKL Tracker Analysis. The anomaly
appears into the airspace. Inside the region of Space, in which this event was captured, several similar events
have been documented which illustrate exactness in the manner in which they appear.. The study is built upon
empirical evidence.
10-28-2019 UFO Red Band of Light 4 Portal Entry Hyperstar 470nm IR RGBKL Analysis Research regarding
unusual events in the Polar Ice Caps, of those unusual events, "Operation Highjump" and the destruction of
the US Naval Fleet in 1946, Antarctica has been swept under the carpet. . In Antarctica, Admiral Byrd was blind
sided by advanced extraterrestrial technology, that quickly overtook the fleet.
_in_Antartica_1947.jpg)
Operation Highjump: The United States Navy Antarctic Developments Program, 1946–1947. How could
Admiral Byrd have known that at the South Pole is an Entry-Exit Wormhole associated to that Magnetic Pole.
Adolf Hitler may have made contact with the aliens which came to Earth via Earths Organic Spatial Portals.
All celestial objects that have magnetic fields that spin, have these properties and anomalies. If the crews
during Operation Highjump encountered objects which suddenly appeared, what would their response time
be for appropriate action? They have never experienced this level of technology.
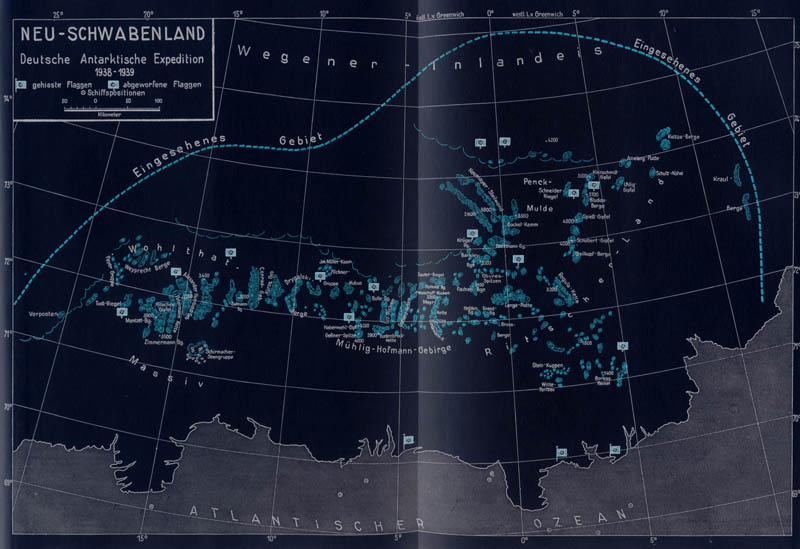
NUE-SCHWABENLAND
What "took out" the fleet may have been extraterrestrial Spacecraft associated to that Wormhole pathway, South
Pole Antarctica. My research, however, is conducted relative to the North Pole in Alaska. (North Pole). My data
shows clearly the way in which ET enters our airspace. In Antarctica magnetic significant anomalies have been
detected. However, they're covered beneath miles of ice. The ice does little in masking its presence. Its possible
that the ice within the magnetic anomalies may also be affected by the magnetism.

A&E History
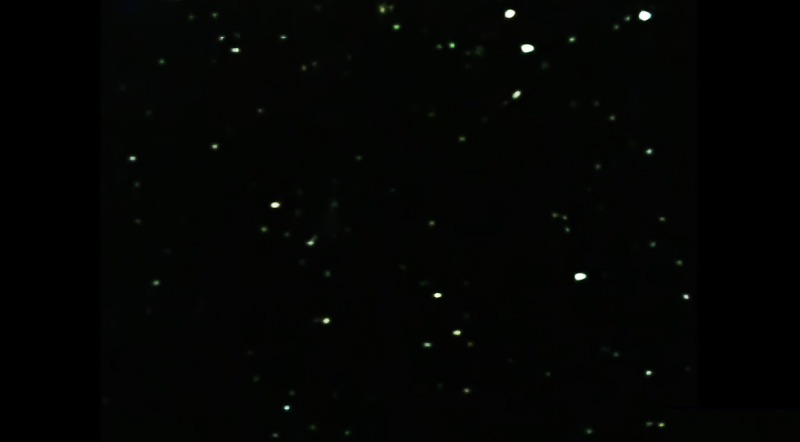
Arctic Circle Research 2015 using ISO 409600 Full Color Night Vision. During this expedition, I did not have FSIR
Infrared capabilities. Scanning this region in Infrared will be most rewarding, to say the least. HP ZBook G2/G3/G4
AVID-Boris Fx Media Composer 2019 Motion Picture Editing Technology. DNxHD200 AVID workflow
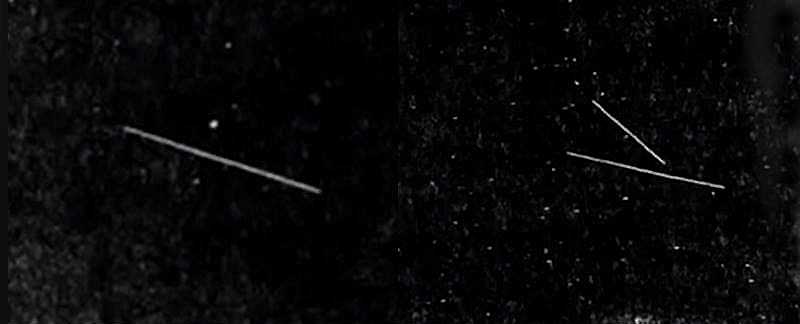
8-12-1960 During NASA Project ECHO, Grumman Ground Satellite technology documented "Red Anomalies"
in our atmosphere. Grumman used 4" x 5" HIE Infrared film 550nm (IR Red). They're still here and in numbers.
This research illustrates the way in which they appear and disappear within our airspace. These anomalies were
also documented on the Lunar Surface during Apollo 14, by Dr. Edgar Mitchell (Apollo 14 Lunar Module Pilot).
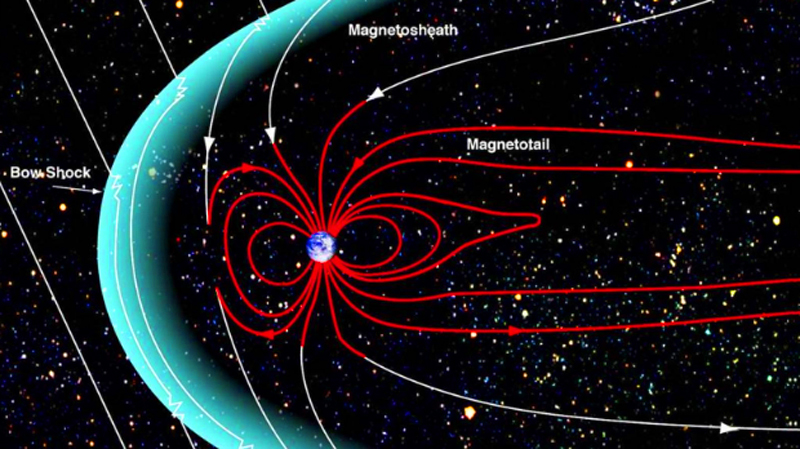
Hidden Portals in Earth's Magnetic Field. NASA's graphic representation is as flawed as their research which limits
events to the Bermuda and Alaska Triangles. The data within this study contradicts the conclusions made by NASA
relative to that which they say is associated with deviations in the magnetic fields along the Equator and North and
South Magnetic Poles (Earth). The illustration below is more realistic. These anomalies can appear anytime,
anyplace.

A more accurate graphic representation based on Self Generated Wormhole technology. My graph suggests
these anomalies can appear anywhere, anytime, anyplace, at will. The enclosed evidence will illustrate this
clearly. Hidden Portals in Earth's Magnetic Field, NASA's documentary on Spatial Anomalies (Portals/
Wormholes)..
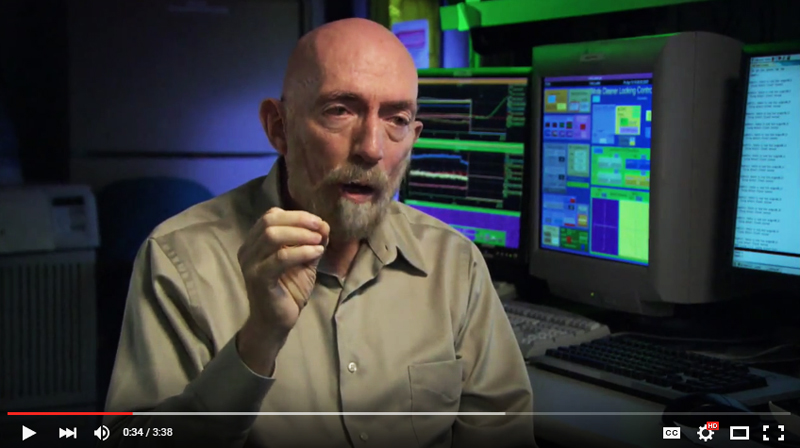
Dr. Kip Thorne -Is Time Travel Possible?
Tracking a UFO is impossible based on our current levels of technology. Invisibility is an element we are not
prepared for, an element of surprise which can be deadly. Time Travel another element of utmost uncertainty,
we have no mastery of technology (to my knowledge) that would allow for Time dilatations. Such technology
would require immense power (nuclear) to bend Time and Space, however; a small reactor would be required.
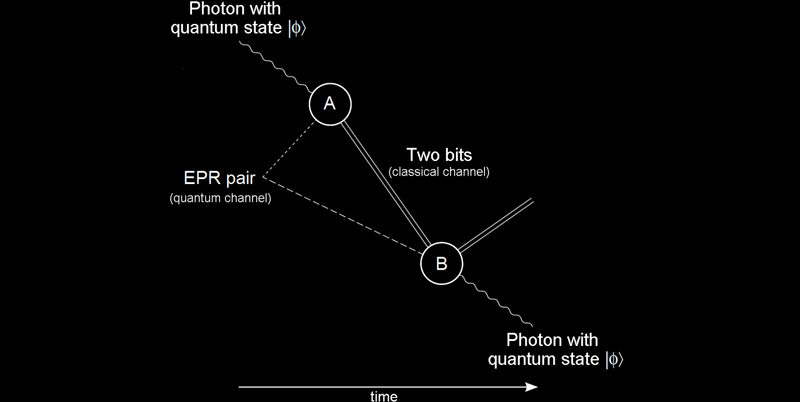
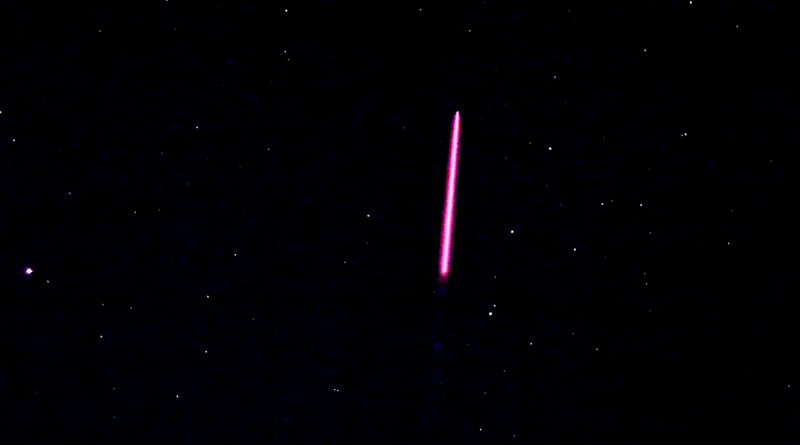
5-08-2020 UFO Band of Light Instantaneous Materialization Hyperstar 470nm IR Analysis. SM An extraordinary
example of Quantum Teleportation. Rather than try to explain events, the actions documented are self illustrated.
This streak of Light anomaly "appears", it does not fly into the airspace.
The updated materials captured via Hyperstar clearly demonstrates the way in which these objects enters our
airspace. NASA is correct and incorrect relative their findings associated with Spatial Portals. My data suggests
that these portals exist everywhere, not just the Bermuda/Alaska Triangles. Hyperstar Infrared data is most
conclusive. Spatial Wormholes/Portals are Self Generated by the ET Spacecraft.
Scientist are finding that the weakening is causing technical problems for satellites, and seems to be growing in its
effects. My evidence suggests these objects are self generating spatial portals.
The evidence is contrary to NASA research which suggests these events are the results of deviations in Earths
magnetic fields. NASA fails to consider Quantum Teleportation, a method in which an object or objects are
transported over great distances via Self Generated means. This research shall highlight Self Generated Spatial
Portals, in which objects "appear", however; not fly into the airspace. This research presents empirical evidence.
The evidence contradicts (conjecture) scientific research, founded on theory and a lack of evidence. The evidence
presented represents 4K Motion Picture technology. Theories are presented as ET Applications, man does not
have this level of technology allowing for large objects to travel over vast distances, and "instantly materialize
on location". Objects which Appear, suddenly appear on radar. Radar does not see from where they come from?
For my analysis (video), I use several tools, inclusive of Hybrid 4K FSIR (Full Spectrum Infrared). My Lens tech
is also hybrid, Hyperstar-Celestron. I have a fixed length (933.3mm f/2.0) lens. On this lens is an Full Color Full
Spectrum Infrared camera (ISO 4 Million). The camera and lens are modified for Infrared applications. Results of
this camera lens combination are the basis of my discussions.
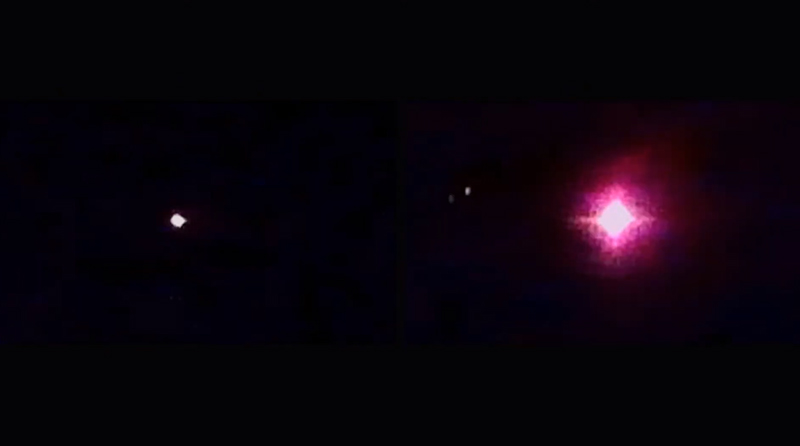
2-03-2020 UFO Tic Tac 1 and 2 Dual Layer Comparative. Rather than attempt to describe the actions associated with
these anomalies, its simpler to allow the sample to illustrate the premise. The materialization of Spheres as documented
Hyperhubble 470nm IR. 2 samples both showing the spheres materialize into the airspace. Both samples show exact
events, yet both spheres are different in size as they materialize in exactness, into the airspace. Both samples are within
a fixed pool of analysis (FPoA). Objects which suddenly appear and then disappear. Both samples illustrate this premise.
Unlike those that came before me, this body of work is built upon Advanced Hybrid Imaging and Lens technologies.
High ISO Normal and Infrared cameras: ISO 204800, ISO 409600, ISO 4 Million. To see the unseen, we have to go
into a realm human eyes cannot perceive.
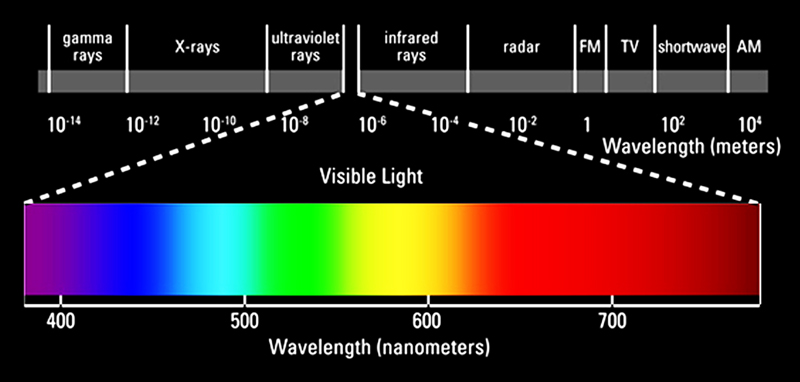
Human Vision. We are all Mr. Magoo. What we need to see, are within the ranges of Invisibility. We cannot see that
which exists outside our ranges of visibility. At night, under streetlight conditions, we would see the following..

Human vision is limited to ISO 1 (Daylight) and ISO 800 (Night time). During daylight hours, our eyes have very
limited spectral range. During the daylight hours, most if not all humans require optical screening in direct sunlight.
In sunlight our iris closes, limiting the amount of light entering and damaging the eyes. At ISO 25600 US Capitol
Building imaged at Night. I'm mixing ambient light with the conditions on the street at 2700K.
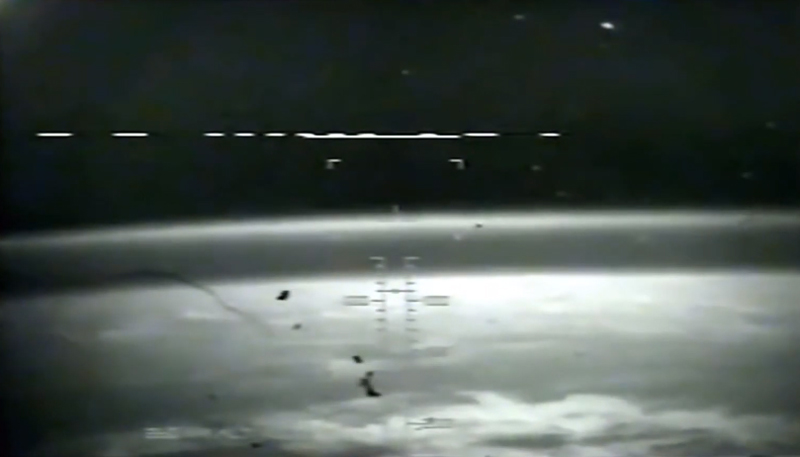
Project Solar Warden real STS-48
I cannot explain how the technology from NASA Apollo era, is higher resolution than that which comes after it? The
transition from Film to digital was not uniform. Film has higher definitions than the first generations of digital imagery
and video. Digital was not so quick to evolve. Digital did not achieve Ultra HD standards until June 2012. These
shuttle samples illustrate the simplicity of Military grade digital. In the 1990's these were by all standards HD Digital.
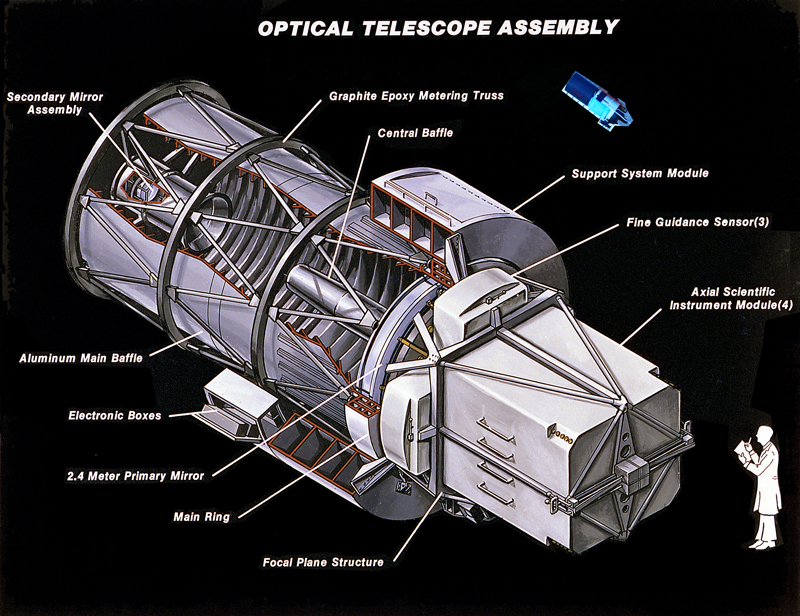
Considering the 8086 processors and 16 Bit digital capabilities of NASA Spatial Imaging Systems. The very same
architecture NASA Hubble is built upon.NASA Hubble maximum ISO imaging sensitivity ISO 1600, with operational
sensitivity at ISO 800, one Hubble image sample can take as long as 30 days to render. The application used to
render these samples operates ISO 4 Million 64 Bit Windows 10 in Real Time @ 60fps 4K. Reducing the size and
weight significantly by (-90%), and drastically increasing its power and optical sensitivity by 100000%, I am able to
achieve Hubble IR in Real Time, without exaggerated over saturations associated with long term exposures.
The inverse applies to our eyes in nocturnal environments. The iris opens to maximum allowing for light absorption,
however, that absorption is limited to ISO 800. Objects which exist in light levels and optical ranges (IR/UV/X-Ray)
exceeding that of ISO 800 and the abilities of the human eyes.. Those objects that are visible @ ISO 800 are
significantly bright, however also are emitting additional ranges of light beyond human capability. This study will
highlight those objects which are within both normal and extreme (invisible) ranges (ISO 51200-ISO 204800*) of
light. I'll focus on that which is "unseen", specifically in extreme ranges* of Light IR/UV/X-Ray, specifically 470nm
through 1050nm.
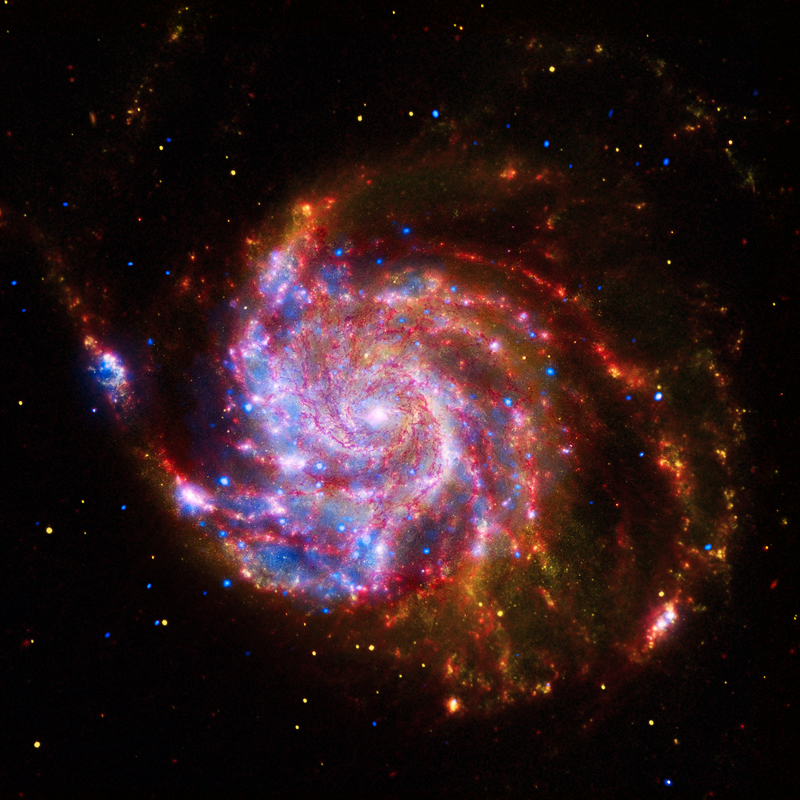
Your first clue is the square image frame perspective (digital prior to 2008). Hubble image samples are long term
duration image profiles. This Hubble sample may have taken 30 days to render @ ISO 800 350nm Near Infrared.
Not being built on speculation, I'm not guessing or forming opinions on "conjecture", however the interpretation
of the visual narratives is rather specific. The image represents a false narrative in rendering an exaggerated image
sample using a 30 day exposure. The over saturated look is the byproduct of over saturation. It is highly unlikely
you will see anything in reality like this, in Space.
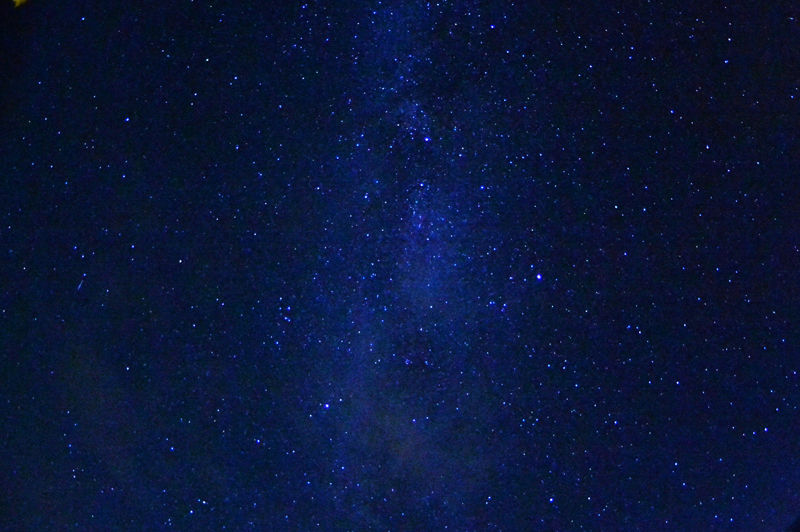
AREA 51 Airspace sampled @ ISO 51200 using 20mm f/2.8 lens . This 2700K sample taken in darkness. The
purpose of the frame is show the format and definitions differences between NASA Hubble (16 bit) and Full Color
Night Vision (64 bit). This frame took 1/30th of a second while the NASA Hubble sample took 30 days to render
its results. In its current configuration, NASA Hubble has shown, though exaggerated, some spectacular things,
however; those image frames took extreme lengths of time to render. While samples rendered in Real Time, lend
more towards reality than that rendered over a prolonged period of time. 1/30th of a second is substantially less
than 30 days. When you look @ Hubble samples note the flaring associated with stars. Those stars are over
saturated during exposure. While Space in Reality is more appropriately represented above @ ISO 51200. If you
look to the center lower left, you will see a streak of light. This is first contact for me specifically with the Band
of Light UFO anomaly referenced in this study.
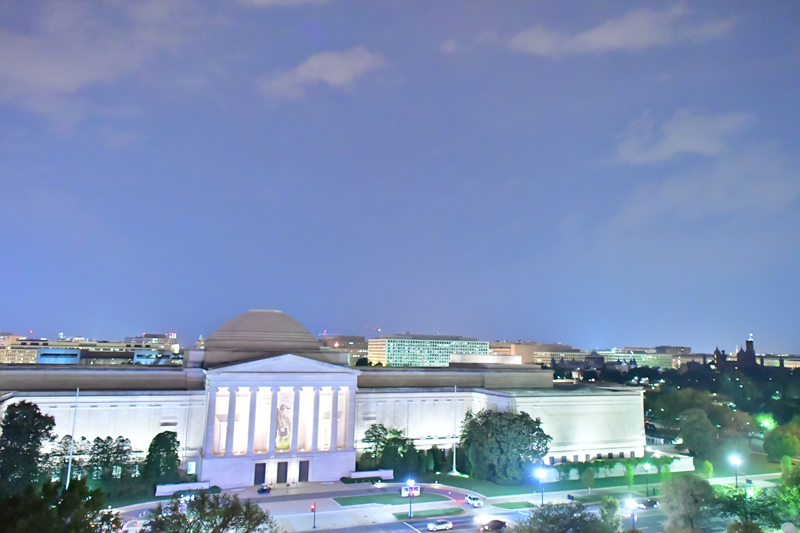
Current levels of U-HD Full Color Night VIsion as illustrated in Downtown Washington DC. Its easier to lead through
example that to describe an event in a worded narrative. FCNV is 4K motion picture technology 60fps. This is a video
frame sample. I'm 10 stories up looking down in image correct perspective (24mm f/1.4). Its humanly impossible
to see this under the conditions in which its filmed (dark). The UHD FCNV sample enhances ambient light significantly.
Which leads to the next sample imaged 60 fps @ 1/250th of a second in darkness (P-53 Restricted Airspace).
![]()
"The way in which these Objects Enter our Airspace".. Clearly, this object does not fly into the Airspace (P-53).
4-13-2015 UFO Cigar Portal Entry Flyby 3dsmax2019 Tracker Analysis 2020. 2700K using 1/250th of a second
@ 60fps. This anomaly appears into the airspace, however; does not fly into it. The Cylinder flyby showed this
object was in a curved trajectory (turning). Its a
full flyby of the Cylinder UFO, captured using Nikon D4S @ 60 fps. In this example, the UFO is maintaining a
curved trajectory. (Its not flying straight). This quality is not one of the properties or attributes of a naturally
occurring phenomena such as a meteor. The definitions of the file (4K) precludes the possibilities of optical distortions.
Objects which "appear" into the airspace, are not flying into it. If not for the scientific documentation associated
with Sudden Manifestations/ Sudden Materializations of anomalous objects in any given Space., one would believe
these objects are flying into our realm from outer space, rather than through Self Generated Spatial Portals.
Terms and technologies used in my research analysis.
SM: Sudden Manifestation (materialization). Objects which suddenly appear.
SDM: Sudden Dematerialization. Objects that suddenly disappear
![]()
7-17-2019 UFO RED Tic Tac Portal Exit Hyperstar 470nm IR RGBKL Tracker Analysis. These anomalies use Field
Propulsion and are organisms. This anomaly incrementally vanishes from the airspace. It did not cloak, a cloaked
object has residual reflective offset, meaning though invisible, it leaves an almost indistinguishable outline which
digital cameras can decipher.
Quantum Teleportation and Objects which "suddenly appear". The sample directly below this is a prime example
of Sudden Manifestation/Sudden Materialization. Filmed 60fps the example clearly illustrates the instantaneous
elements associated with the appearance of these objects.
![]()
8-25-2020 UFO Tic Tac 4 Flyby SM SDM Hyperstar 470nm IR LRGBYCM Tracker Analysis. This anomaly appears
and disappears several times throughout this event.
SMSDM: Sudden Manifestation (materialization) and Sudden Dematerialization. Objects that suddenly disappear.
RGBYCM or combinations of, R=Red, G=Green, B=Blue, Y=Yellow, C=Cyan, M=Magenta.
(My cameras are filming 2700K-500K Normal Light and Full Spectrum Hyper Infrared)*
Commercial FLIR is ISO 25600, while my systems FSIR are ISO 204800 and ISO 4 Million.
This data is built upon unconventional means.
Autodesk 3dsmax2019 for Virtual camera tracking technology
AVID Media Composer 2019 with Boris Fx Continuum 2019
LifePixel HD IR filters and augmented systems.
Nikon Systems 4K, Nikon ViewNX-i, Camera Control Pro 2 autonomous camera controls.
My platform generates forensically pure data, unpolluted by light or human interference.

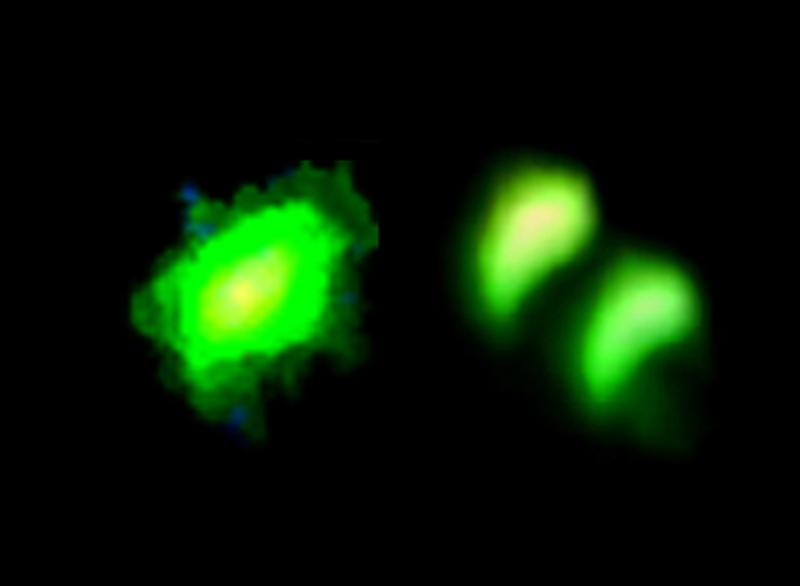
6-04-6-14-2019 UFO Tick Tac Hyperstar 470nm Comparative Analysis. Quad layering 4K videos in Autodesk
3dsmax2019 in an 4K environment, generating an Ultra HD Quad Layer Visual Analysis showing similarities and
differences in 4 different Tic Tac events. My comparatives are most surprising! Microbes and virus with exact
characteristics as the Tic Tac anomalies above. Here, "As Above, So Below" applies.

Why do these microbes and bacterial viruses look like Tic Tac UFO's?
Filming in Hypercolor 470nm IR allows for Full Spectrum Infrared colors RGBYCM color gradients. These are no
references for this technology. It is Hybrid, and I'm writing the book as we go along.
![]()
7-04-2020 UFO Tic Tac 2 Flyby Energetic Hyperstar 470nm IR LRGBK Tracker Analysis. These are ET Organisms .
7-09-2017 UFO Band of Light SM FB Analysis. A clear example of an object that suddenly appears into the
airspace. "The way in which the appearance and disappearance of UFOs taking place in our atmosphere" In
an obviously clear sample, this object appears from out of nowhere? Clearly indicating the validity of a Spatial
Anomaly: Portal within my fixed pool of analysis. Objects appear initially stationary, however; examples such
as the following, shows motion associated with the objects manifestation into this realm. It appears 100%
stationary, and then goes to WARP. 1990. :"At this time, without a doubt, the Americans already knew very well,
the way in which the appearance and disappearance of the UFOs taking place in the atmosphere of our planet"
(1990).
Russian Probe Phobos 2 IR digital camera final transmission prior to destruction by Unknown ET.
I'll start with events and anomalies captured in our (Human) Visible Band/coherent ranges of light 2700K-5000K. If
you're familiar with 35mm Film photography, you will understand the differences between Tungsten and Daylight
balanced films: 2700K-5000K. Note the consistency of the following anomalies imaged using 4K camera technology.
Massively large Cylindrical anomaly
These are examples filmed 2700K using a 24mm f/1.4 lens, 1/250th of a second shutter speed @ 60fps. We can
rule out blurring from the equation based on the conditions in which motion is recorded in 24mm. The manner in
which each example manifests into the airspace, is exactly the same. The anomaly incrementally manifests into the
airspace. (P-53 Restricted Airspace, Washington DC) Visible Light 2700K. Note this sample, and the samples that
follow, directly below.
![]()
5-04-2014 UFO Cylinder Portal Entry Tracker L Analysis 2019. Taken from P-53 Restricted Airspace Fixed Pool of
Analysis (FPoA) In P-53 Restricted Airspace, 4 blocks from the White House, this rather large tubular shaped craft
was imaged within my Fixed Pool of Analysis. My area of analysis never deviated, the only deviations made were: the
lens and camera configurations which included FSIR (ISO 204800). Interestingly, each shows the same anomaly
essentially enter within the same region of space. D4S 60fps, 1/250th of a second.
![]()
1-05-2017 UFO Cylinder Portal Entry 3DS Tracker Analysis 2019
3 years apart, and within the exact same pool of analysis, we see the exact same event and anomaly as 5-04-2014
UFO Cylinder Portal Entry Tracker L Analysis 2019. Nikon D5 60fps using 24mm f/1.4 @ 1/250th of a second. Immediately
we rule out blurring associated with slow frame rates and shutter speeds. 60fps High Speed video is Ultra HD, filmed
4K format. Understanding the conditions in which these examples are filmed we can dismiss speculation that these
are the results of extended exposures. On this day 27 people vanished without a trace, inclusive of their cellphone
signatures, in NE Washington DC, the angular trajectory of this anomaly.
5-04-2014, 1-05-2017 UFO Cylinder Portal Entry Dual Layer Analysis.
UFO P-53 Restricted Airspace Washington DC Band of Light Dual Layer Analysis. Each layer is filmed in the exact
same manner and location. In each of the examples, the "anomaly" simply appears, however does not fly into the
airspace as one would imagine. Each is within range of Human Visibility. However there are some, that are not.
They exist within the range of Human Invisibility (IR/UV/X-Ray). Humans see within a very narrow range of light.
Without a light source, we can see nothing. The anomalies are entering the airspace in unconventional ways, the
pathway in which they entered was predetermined. (Planned), not happenstance. The FPoA shows without doubt
this is not happenstancial.
12-27-2017 Cylinder Band of Light SM WARP FB Analysis 2, this is a 24 mm f/1.4 sample filmed @ 60 FPS. The
anomaly imaged is immense in size, based on this 24 mm sample. The object is minimally at 10,000 feet altitude.
Even at this height, the object is immense (Huge).! From what I have seen personally, it makes an Nimitz class carrier
look like a Cessna next to the Empire State Building in NY. The evidence indicates a presence within our airspace,
with technology which exceeds our technological state, significantly.
![]()
9-05-2020 UFO Red Cylinder Cigar 1 Portal Entry Hyperstar 470nm IR RGBYCM Tracker Analysis
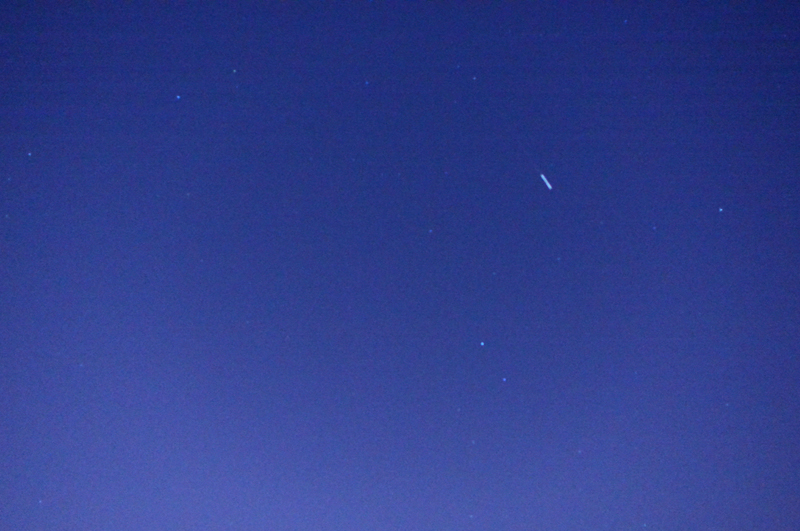
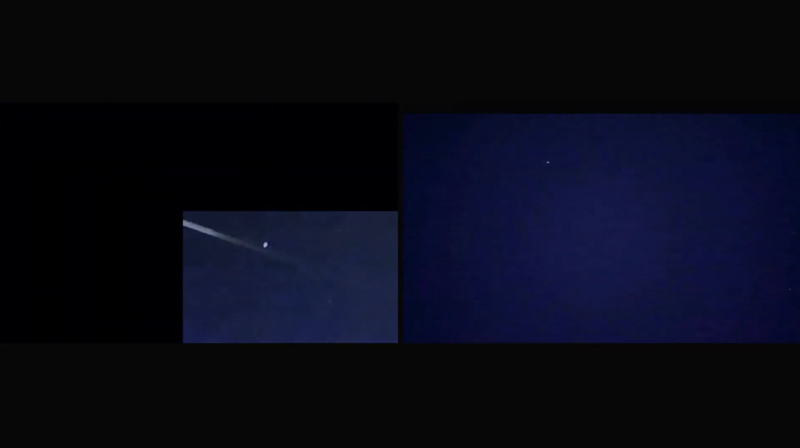
Shreveport, Louisiana 11-01-2012. In a 550 frame sequence taken at 00:41:45 AM, we have 1 frame which shows
a luminous object and contrail, as it ascends into Shreveport. Atmospheric conditions in Shreveport are poor. There
is excessive light and air pollution in this immediate area. I matched this frame sample to video footage taken in
Japan 11-15-2012. (Below)
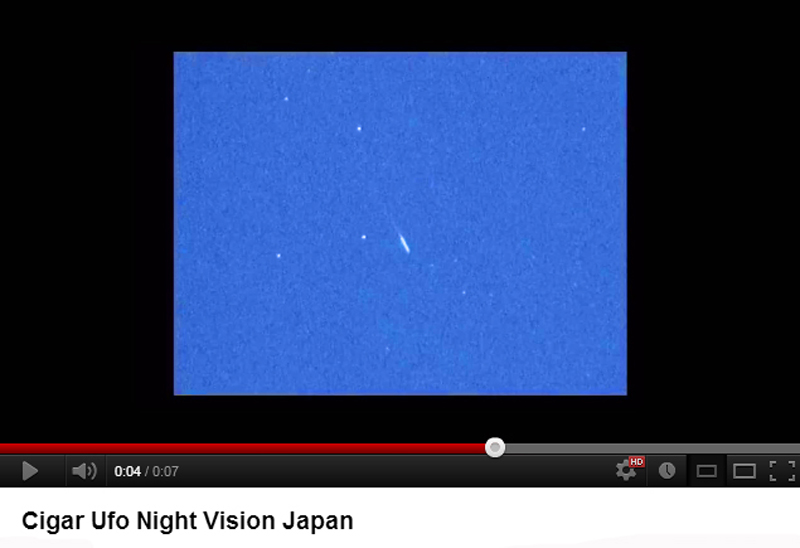
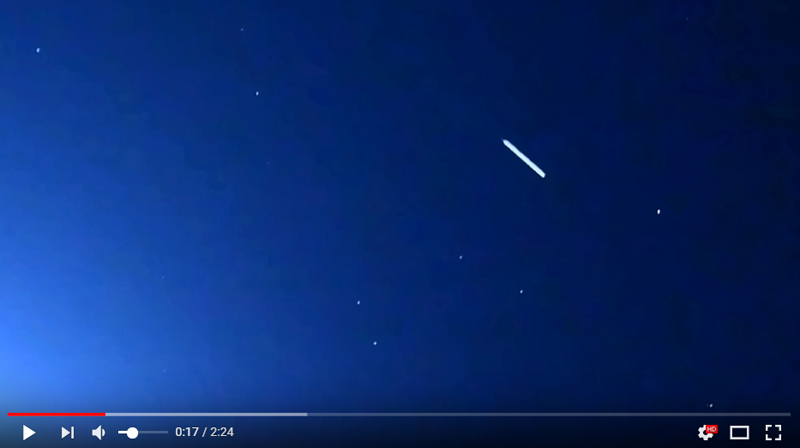
November 16, 2012, 15 days after my initial capture, this stunning video was filmed in Japan. The
example is a 100% match to Shreveport Louisiana 11-01-2012. D4 Nikon Analysis (My Big Redneck
Vacation: MTV-CMT)

NASA ISS. Nikon D3S
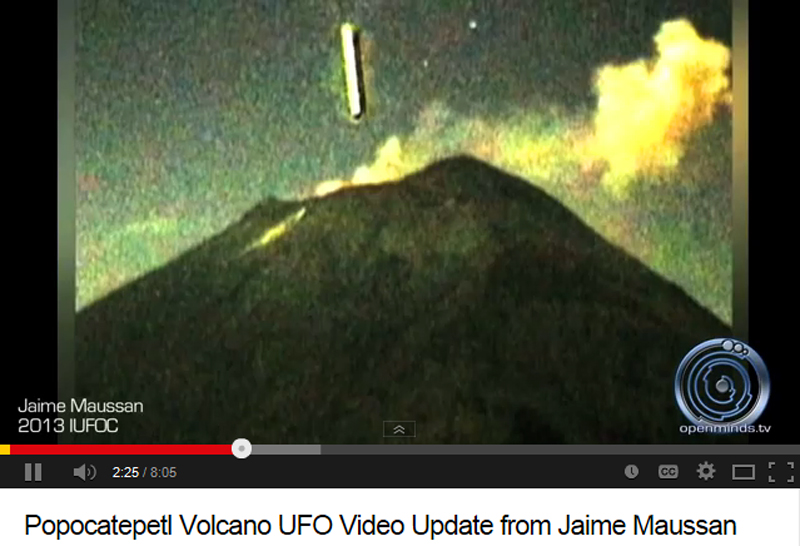
Mexican Cylinder Cigar UFO entering Popocatepetl Volcano reported by my associate Jaime Maussan
8-19-2018 UFO Cylinder IR 24 mm Time Lapse

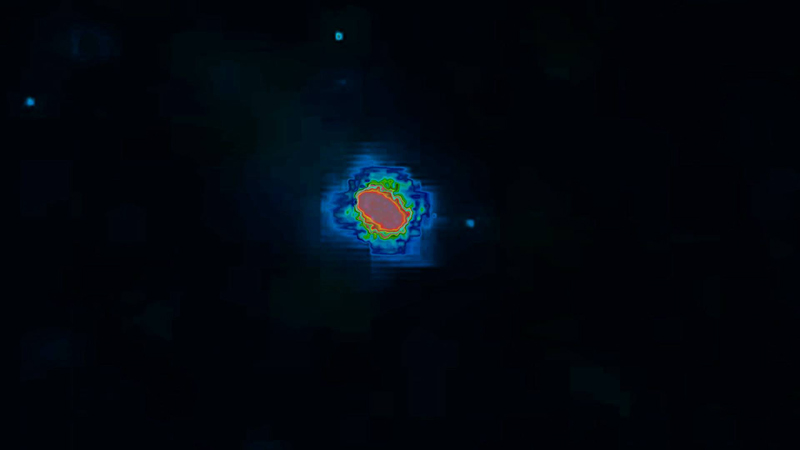
12-22-2018 Anomaly Daylight Flyby Hyperstar 470nm IR RGBK Analysis. There are 2 levels of analysis associated
with this file. Analysis 2 incorporates a second layer of analysis, showing the energy fields associated with this object.
I am unable to determine what kind of aircraft (if any) this is? It appears to be 5 interconnected green compartments.
![]()
3-18-2020 UFO Cigar Portal Entry Hyperstar 470nm IR RGBKL Tracker Analysis
2-06-2021 UFO Red Cigar Band of Light WARP Flyby 2000mm FSIR RGBYCML Analysis
![]()
A ship encompassed in Energy, generated by nuclear propulsion systems (ET).
3-20-2021 UFO Red Cigar Band of Light Flyby Hyperstar 470nm
![]()
3-20-2021 UFO Red Cigar Band of Light Flyby Hyperstar 470nm IR RGBYCML Tracker Analysis

2-06-2021 3-20-2021 Red Cigar Dual Layer Comparative
4-15-2018 UFO Band of Light SM FB HCIR Analysis. Another First: Hyper Color Infrared UFO capture using Hybrid
Nikon D5 IR. The same tubular cylinder object captured 24mm f/1.4 470nm IR filtration. This brings me to the
Spheres documented by my systems.
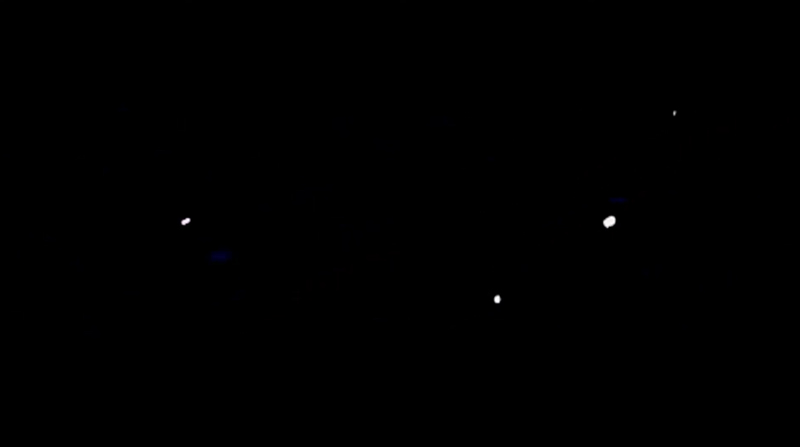
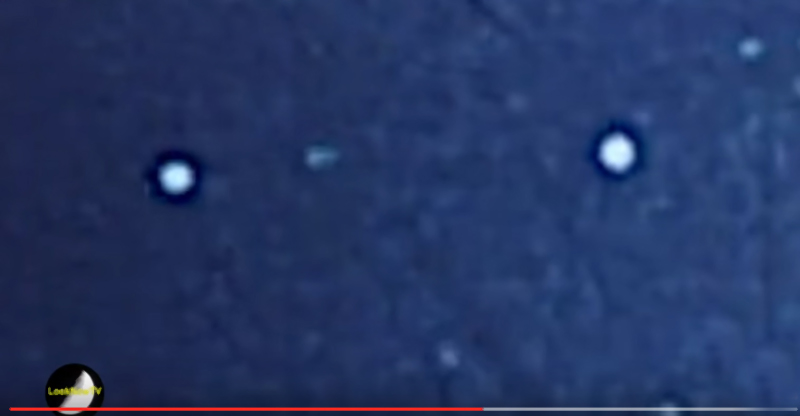
4-25-2016 UFO Sphere Triangular Formation SM SDM Analysis: Proof positive Portals exist. In this clip there are
3 Spheres, they decloaked and cloaked again, vanishing from the image area. With multiple events within my pool
of analysis, plotting the location of each event would gauge the approximate locations of these portals. They are
moving in tandem, however; they're manifesting into the airspace, not flying into it. The sudden manifestation is
also illustrated on the Russian ISS footage below, also showing the spheres in Space in formation *. (Russian ISS
video below). The appearances of these anomalies is the same regardless of the location of event. (Earth/Space)
Russian ISS video showing UFO objects suddenly materializing into Space, through a portal associated to the
North or South magnetic Pole. The object in the Russian spatial footage suddenly appears. It had to exit a portal
to enter this realm or area specifically. Based on this research, these spatial portals maintain relative geospatial
positioning, (they don't move, maintaining a relative fixed positioning).. This study is based on relative geospatial
positioning associated to the analysis pool. My approach is simple; I match objects in Space with objects I imaged
on Earth (some with sounds). They're a 100% match.
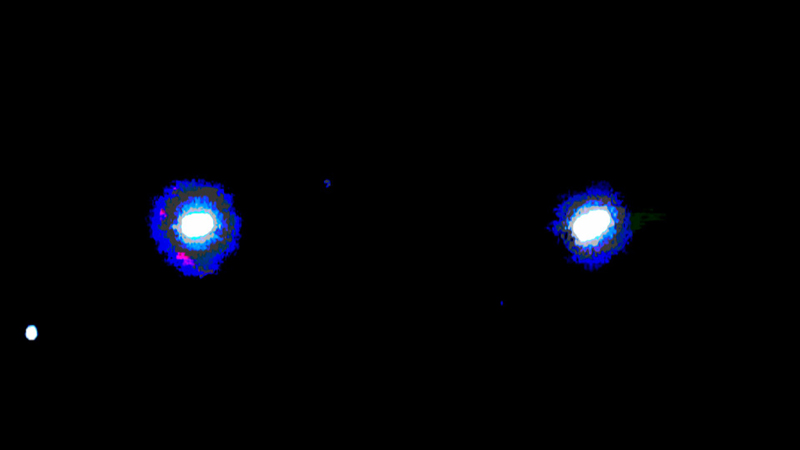
5-24-2015 UFO Spheres-Pairs SM Event 6 Analysis. Unlike my many other examples of this paired UFO tandem
flight anomaly, this is the first in which these objects materialize into the image frame*. The materialization of
objects in my fixed pool of analysis. (Continued below in the "Anomalies section").
1952 Delbert Newhouse UFO footage, Tremonton, Utah example of what is referred to as Luminosity's To
see actual story of 1952 Montana UFOs. These anomalies are still within our airspace. This 1952 event matches
with 100% certainty anomalies captured in FSIR 3-01-2016 in P-53 Restricted Airspace Washington DC. (Below)
3-01-2016 UFO Pairs Flyby IR Tracker Analysis 3. In my analysis of this footage, I discovered there were other
unseen anomalies which appeared and vanished within this video segment. An infrared sample, and the objects
color maintained a red tint throughout the video event.
3 -24 -2014 UFO flyby Analysis 2 Washington DC, Matching anomalies based on past documentation. This-2014
Modulating Red and White Sphere is a match to the paired UFOs above: 3-01-2016 UFO Pairs Flyby IR Analysis
FSIR 470nm Hypercolor Infrared 4K samples.
7-09-2020 UFO Tic Tac Energetic AM-PM Flyby Hyperstar 470nm IR Dual Layer Analysis B. This sample clearly
illustrates that these 2 files are both showing the exact same anomaly 12 hours apart and within the same FPoA.
The USS Nimitz Tic Tac anomalies, ET Organisms. An advanced ET
Biological organism , with modulating and extensive Energy Fields.
10-23-2021 and 10-31-2021 Energetic Tic Tac Flyby Hyperstar 470nm IR LRGBYCM Dual Layer
Analysis

Dr. Edgar Mitchell Apollo 14 EVA 1 DNxHD 200 digital Remaster (W. Allen). The US Navy were not the first to
encounter or document Tic Tac anomalies. Those honors go to Dr. Edgar Mitchell Apollo 14.
Dr. Edgar Mitchell Apollo 14 Mission Footage LEM Deployment UFOs . By all definitions, these
small luminous spheres match the definitions associated with the Tic Tac anomalies encountered
by the USS Nimitz.
USS Nimitz Tic Tac anomalies are Extraterrestrial Biological organisms. I have over 2700 examples
of the Tic Tac, each of which cannot be matched with any other within its collective. These objects
undulate and are 100% consistent with Microbes. "As Above, So Below".
11-29-2017 UFO Band of Light FB Analysis. At 60 frames per second, we have the exact same anomaly documented
in AREA 51 Nevada while filming My Big Redneck Vacation (CMT) Orion Newtonian Reflector f/3.9 using D5 @ 60fps.
2000mm
Apollo14 16mm DAC footage DNxHD 200 remaster (W. Allen)
NASA Apollo 14 Mission Footage EVA 1 UFO Pairs and Band of Light SM SDM (Ultra HD Remaster).
For Dr. Mitchell to see and capture this, it had to be apparent within the human range of vision
(5000K/Daylight balance). The light illuminating the astronauts is direct Sunlight.
(Wormholes: Dr. Edgar Mitchell and Wilbur Allen) The anomalies on the 16mm DAC footage were
interpreted as systemic glitches.
11-11-2019 UFO Band of Light SM SDM Hyperstar 470nm IR RGBKL Analysis. A Dr. Edgar Mitchell moment! This
event is similar to an event imaged by Dr. Edgar Mitchell during Apollo 14 EVA 1. However this is not a systemic
glitch

4-01-2022 UFO Tic Tac 6 SM SDM Hyperstar 470nm IR LRGBYCM Analysis This anomaly "appears" and then
"disappears", instantly.
. This anomaly "appears" and then
"disappears", instantly.
4-02-2022 UFO Tic Tac 4 SM SDM Hyperstar Analysis. These anomalies "appear" and then
"disappear", instantly. It appears and disappears in the same region as :
4-01-2022 UFO Tic Tac 6 SM SDM Hyperstar 470nm IR LRGBYCM Analysis
![]()
9-05-2020 UFO Band of Light FB Hyperstar 470 IR LRGBYCM Tracker Analysis
![]()
9-06-2020 UFO Band of Light Flyby Hyperstar IR LRGBYCM Tracker Analysis
9-05/ 9-06-2020 Dual Layer Band of Light Analysis
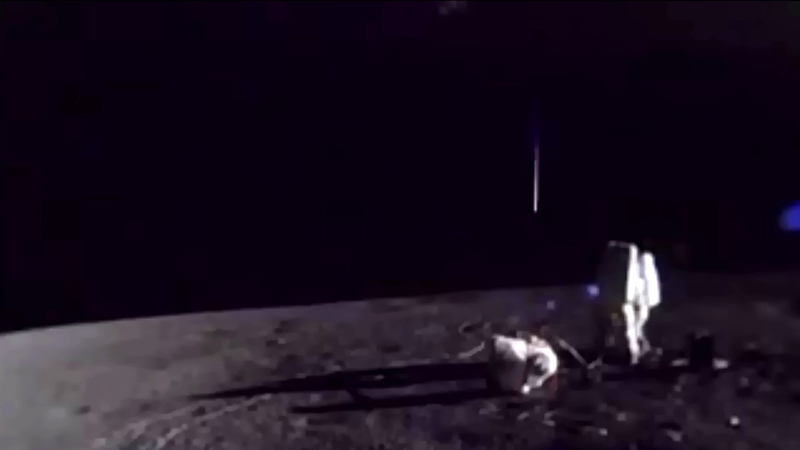
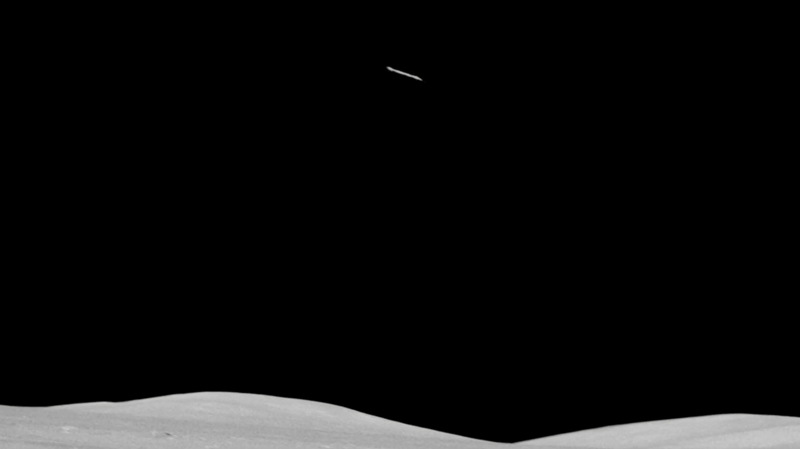
Dr. Edgar Mitchell Apollo 14 Mission Footage Lunar Surface Luminosity SM SDM. The anomalies on
the 16mm DAC footage were interpreted as systemic glitches.
Dr. Edgar Mitchell Apollo 14 Mission Footage Command Module and UFO SM SDM. In this footage
an anomaly appears and then disappears, interpreted as systemic glitches by NASA Ground crews.
*My associate Dr. Edgar Mitchell (Apollo 14 EVA 1) has this specific event (SMSDM) on the Lunar
Surface. NASA interpreted that the streak of light was a Flare, while Doctor Mitchell saw a ship of
Light or what's referred to as a Light Ship/Band of Light UFO, ie: The Third Object JAL Flight 1628.
Additional Apollo 14 Lunar Surface footage with a stationary Airborne UFO Band of Light Anomaly. The anomaly
maintained 100% stationary positioning during this photo session.
Photographs were collected during the Apollo Program, primarily with Hasselblad and Nikon cameras.
Footage. Dr. Mitchell described the object as massive! This event is 100% consistent with what my advanced imaging
systems are documenting. Second contact was most abstract! I had just climbed a mountain with 60 lbs of equipment
on my back. When I got to the top, my body was destroyed. I returned to the hotel in extreme pain, my body was
destroyed by the climb. However; in my sleep I received a command to wake up (telepathically) When I arose, the
pain to my body was completely gone? I was asked to setup my camera behind my hotel room door, as instructed,
I did. 2 minutes after hitting start, the object materialized into the video (above). It gave me 2 commands, 2
locations, virtually the same, however; one showing the object entering and the other showing it exit the Sedona
Airspace. Time Lapse requires a frame rate to play on video players , in using 30 fps as
my frame rate. (above and below). Each video is processed in AVID Media Composer using DNxHD 145-200
AVID workflow.
Within my pool of analysis, I was able to document conditions in which these objects appear and disappear, with
higher definition than NASA's initial documentation onboard MIR in thee 1990's.. How ET Enters Our Airspace
Many had problems associated with these time lapse images, suggesting that I extended the duration of the
exposure to get these samples? However; that's a feeble notion and does not stand up to scientific scrutiny.
Video taken at 60 fps has a base shutter speed of 1/60th of a second.
US Navy Solar Observatory video sample 2013.
The data forwards is 4K Hyperhubble 60fps motion picture. Note the consistency in data from Apollo 14 EVA 1 &
data presented within this study. Hyperhubble (ISO 204800/ISO 4 Million) vs NASA Hubble (ISO 1600). There are
no comparatives. The architecture of Hubble (8086 16 bit digital). Its operational range of sensitivity ISO 800.
![]()
8-10-2020 UFO Band of Light Instantaneous Materialization Hyperstar 470nm IR Tracker Analysis. Clearly, this anomaly
suddenly appears into the airspace. It appears stationary, then goes to WARP. (SM). This is 64 Bit digital 4K technology.
All files 60fps.
![]()
8-11-2020 UFO Band of Light Instantaneous Materialization Hyperstar 470nm IR LRGB Tracker Analysis. I am filming
60fps @ 1/200th of a second. At this rate, I should be able to see objects in motion with limited if any relative motion
blurring. In the samples these is none (motion blurring). This anomaly appears into the frame then goes to WARP. My
data is obtained within a fixed controlled environment. The lens is targeted and locked precisely in one region of Space.
Geospatial targeting based on fixed geographic location. The lens does not move, however tracks along Earths rotations.
The lens is aligned NSEW, the alignment never changes.
ESA submission from Paris France: José Bouillon (Click on image) 3-31-2019 The next day 4-01-2019, my systems
captured this anomaly ..directly below
4-01-2019 UFO Band of Light 2 WARP Flyby 2000 mm RGBK Analysis. D5 Nikon 60fps @ 1/100th of a second shutter
speed. In IR, this may have translated as a Red Band of Light anomaly. However, to better illustrate the way in which
these objects enter our airspace, I present the Red Band of Light anomaly initially documented by Grumman Ground
Satellite Tracking technology 8-12-1960
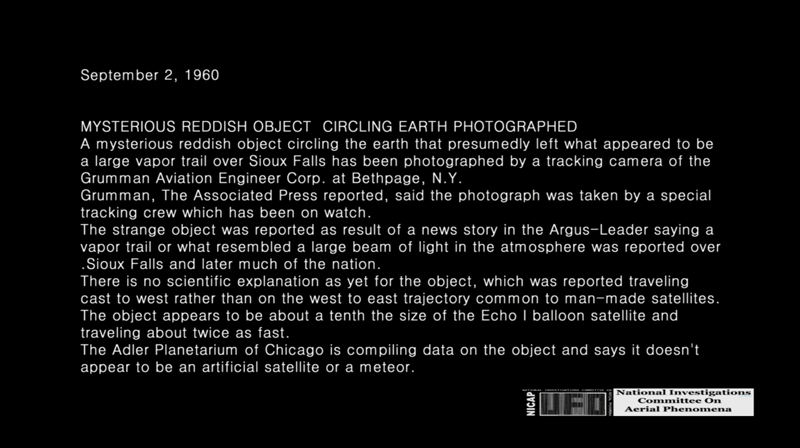
Grumman Ground Satellite Tracking technology 8-12-1960. Grumman tracked and documented the anomaly using
advanced film technology in the 1960's. However; their interpretation of the data is incorrect: NASA Project Echo.
The strange object was reported as result of a news story in the Argus-Leader saying a vapor trail or what
resembled a large beam of light in the atmosphere was reported over Sioux Falls and later much of the nation.
There is no scientific explanation, as yet for the object, which was reported traveling cast to west rather than
on the west to east trajectory common to man-made satellites.
This Grumman example serves as the basis of analysis to this study. What's imaged is not a vapor trail, however; an
extraterrestrial craft, imaged below at 60 frames per second. The multiple examples ranging from 500nm-950nm IR,
through Full Color Night Vision at 60 fps. The multiple samples are comparative forensically. This also serves as an
example of an erroneous analysis. What was seen was not a vapor trail. A vapor trail does not have prolonged longevity,
just as these samples cannot be meteors upon entry into Earths atmosphere.
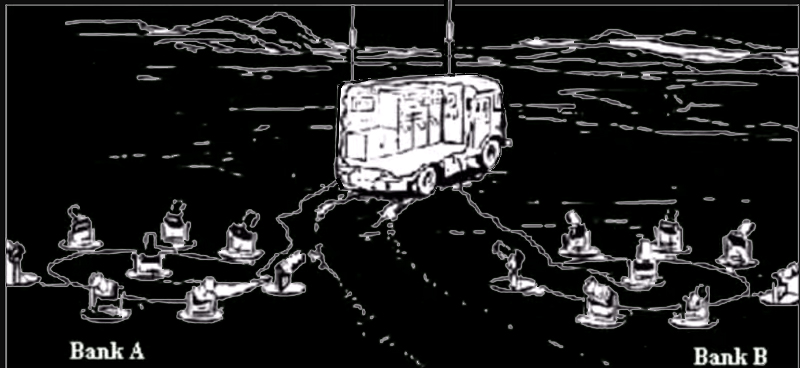
NASA Project Echo was monitored independently by Grumman Ground Satellite TRacking Technology developed in the 1960's..
The Grumman imaging array systems setup, documented the Band of Light UFO object using a
multiple camera system. Though film based systems, this concept substantially upgraded, is
utilized in this forensic documentation.

9-18-2018 UFO Band Of Light Hyperstar 470nm IR Analysis PC
The design and operational parameters of my Optical array, is built upon the concepts used by
Grumman in 1960. The changes in the array start with the camera systems used in the system
upgrade.In 1960 Grumman used large format cameras and film to capture Spatial events.
6-27-2019 Band of Light Green tail Close Flyby Hyperstar 470nm IR RGBKL Analysis
The monochromatic film 4x5 was not able to capture the Red UFO Band of Light anomaly in its
true colors. The film media had not upgraded or advanced. Film as it was in 1960, was limited
at best to ISO 1600 (ISO 400 Pushed 2 Stops).
Grumman 3-08-1960 (Video comparative analysis)
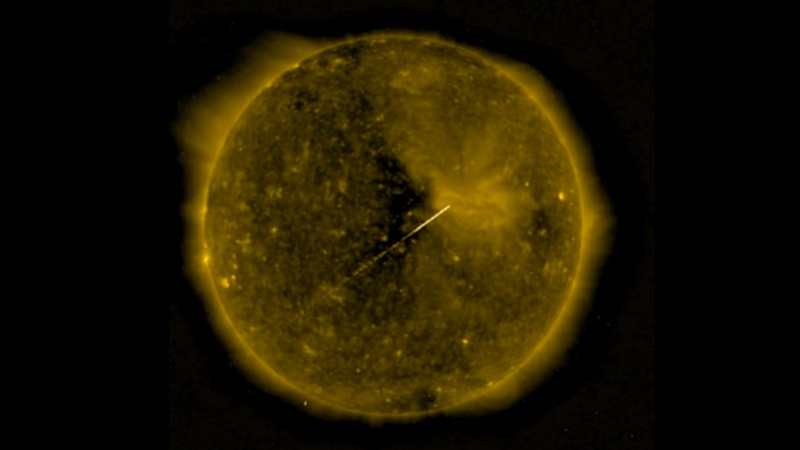
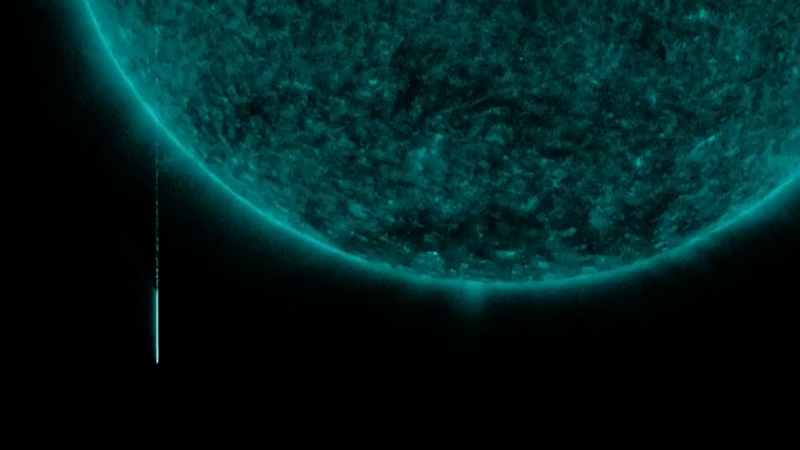
2013 US Navy Solar systems detected an anomaly passing the Sun in its telescopes focus field
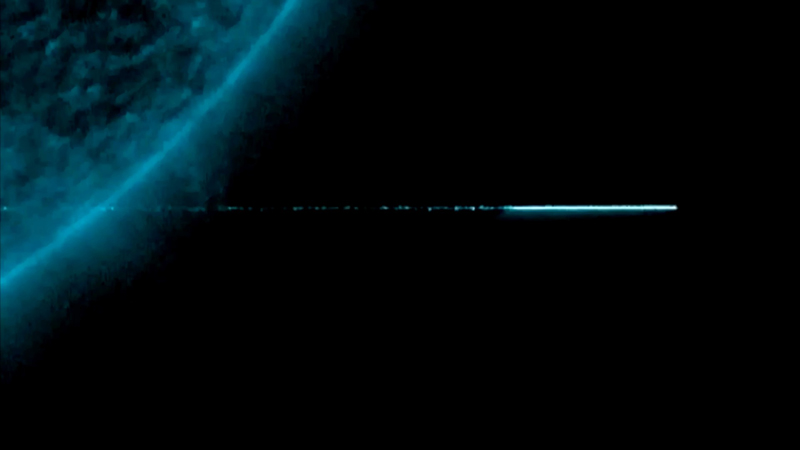
US Navy Solar Observatory image sample 2013. This anomaly and those like it, are within our Airspace.
All the data is built upon existing evidence. However, my data is built upon Hybrid Imaging and Lens systems. All
samples 60fps.

6-27-2019 Band of Light Green tail Close Flyby Horizontal Analysis. Based on the comparatives (USN) and this sample
I would say the anomaly imaged by the USN is in our airspace on a regular basis.
The manner in which the Red anomaly, initially imaged by Grumman, came into view was under
extraordinary circumstances. I was not sure (initially), what I was seeing, until I slowed the footage down by -91%,
9% its original frame rate, slowed down in AVID Boris Fx. My Video Standards are DNxHD200 Avid Workflow.
The data from Hyperstar 470nm-550nm Infrared in 4K.
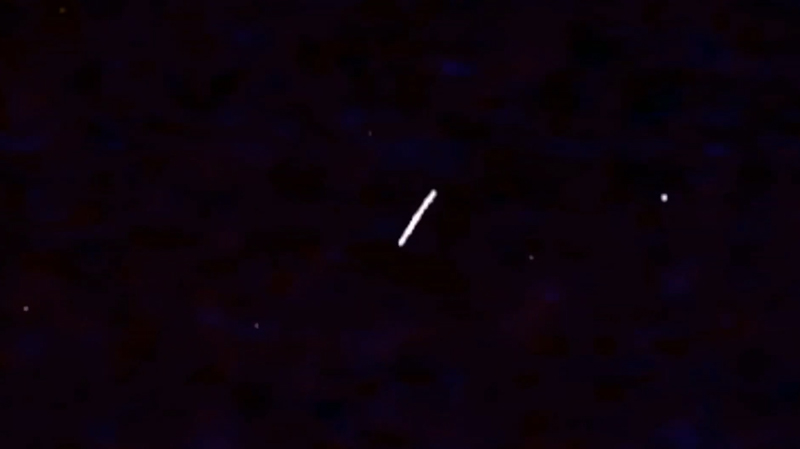
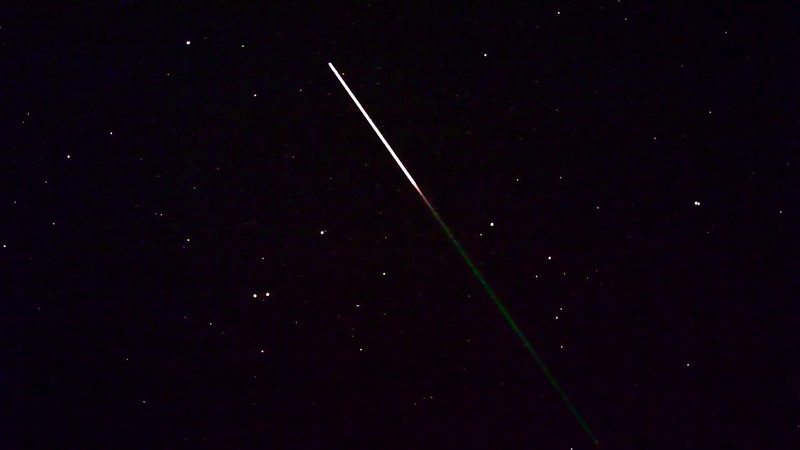
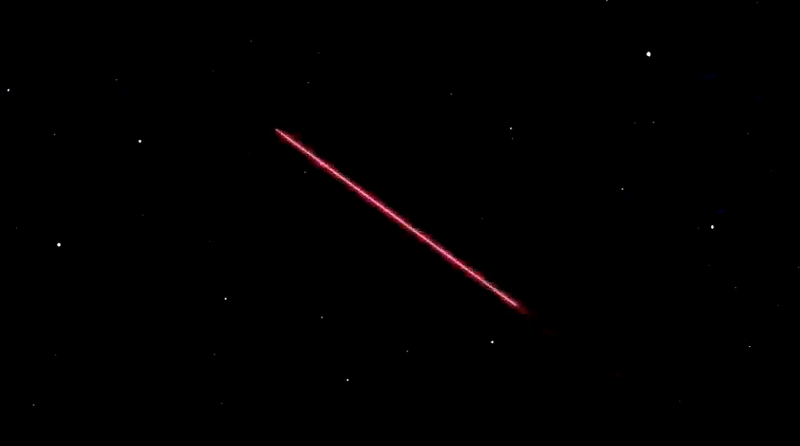
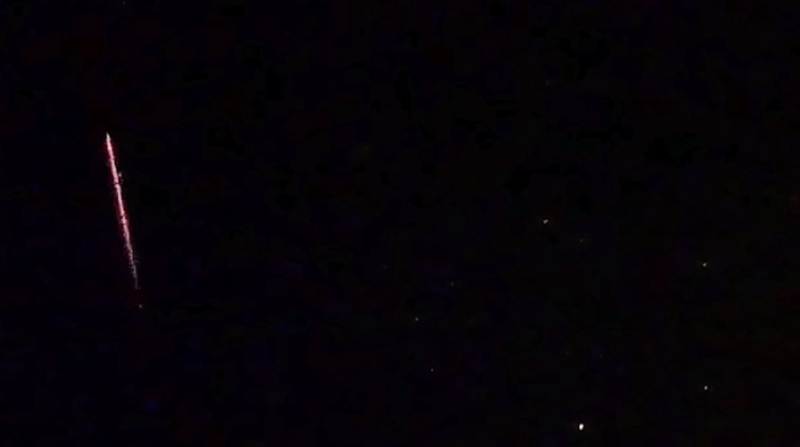
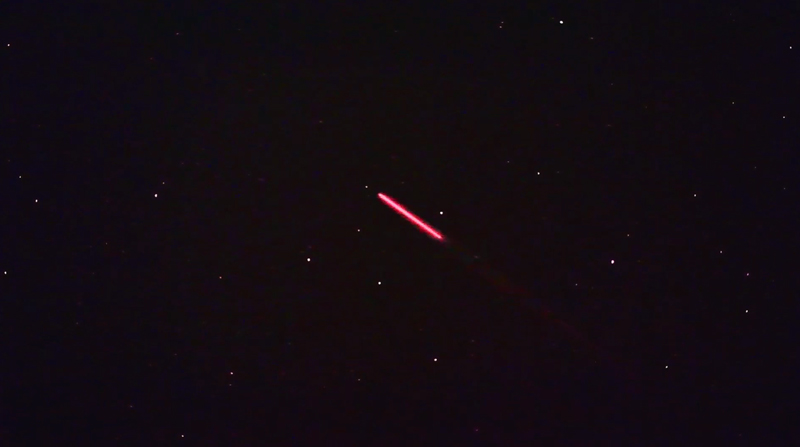
10-19-2019 UFO Red Band of Light Massive Flyby Hyperstar 470nm IR RGBKL Analysis. This sample illustrates
the connection between the White anomaly above, and the Red energy field around the object directly below. Based
on this example, the Red energy field is a component byproduct of the White Spear like streak of light (Band of Light)
as termed by the definitions associated with the massive object(s) encountered by JAL Flight 1628 Alaska.
https://en.wikipedia.org/wiki/Japan_Airlines_Flight_1628_incident
4-29-2019 UFO Red Band of Light WARP Flyby Hyperstar 470nm IR RGBK Analysis Matching with 100% preciseness, the
description of the Red Anomalies in our atmosphere 8-12-1960 during NASA Project ECHO. The Full Spectrum
Infrared sample shows an object with a "Red Energy Field around it". The HD forensic sample is unlike any
anomaly, except the ones which appear as White with a Green Energy Tail.. Its High Definition qualities make
it an excellent source of analysis. The field energy variations around this craft are extraordinary. As are
its operational capabilities. Understanding the dynamics of this spacecraft and its capabilities upon Entry
and Exit of this Realm.
![]()
8-27-2020 UFO Red Band of Light Portal Entry Hyperstar IR RGBYCML Tracker Analysis. This anomaly appears into
the airspace. Its appearance is no surprise. This specific event has been documented 27 times from this exact region
of Space, as illustrated in this study. The documents presented are AVID DNxHD200 digital workflow. All examples
are 60fps video streams, except for 2013 Time Lapse which are 30fps digital video streams. 3K video
7-18-2018 UFO Red Band of Light 4 Portal Entry WARP Hyperstar IR Analysis.
At first, I was not sure what I was looking at, looking at the sample in the frame rate it is filmed upon 60fps. Secondly, if
at all, any of this is visible to human eyes? However to obtain samples, seconds, minutes, hours, days apart, from within
a FPoA, showing multiple samples of the same things ..within the same region of space as defined by the Lens. Uniform
consistency in all the files forwards. They're all Red Band of Light UFO anomalies as documented by Grumman Ground
Satellite Tracking Technology 8-12-1960 during NASA Project ECHO.
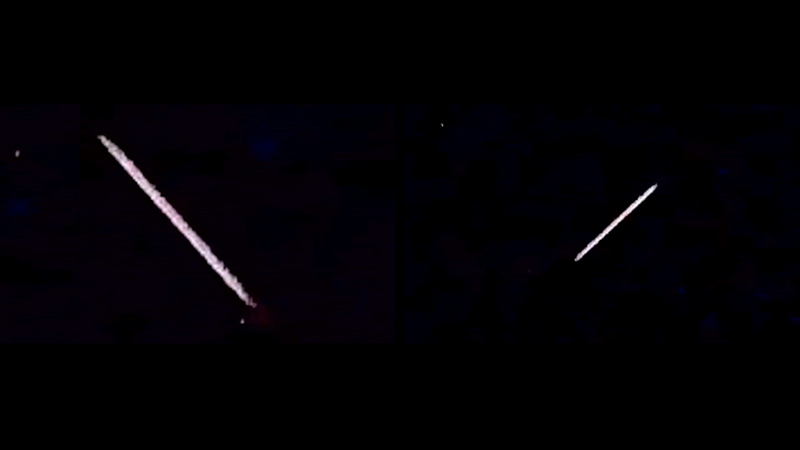
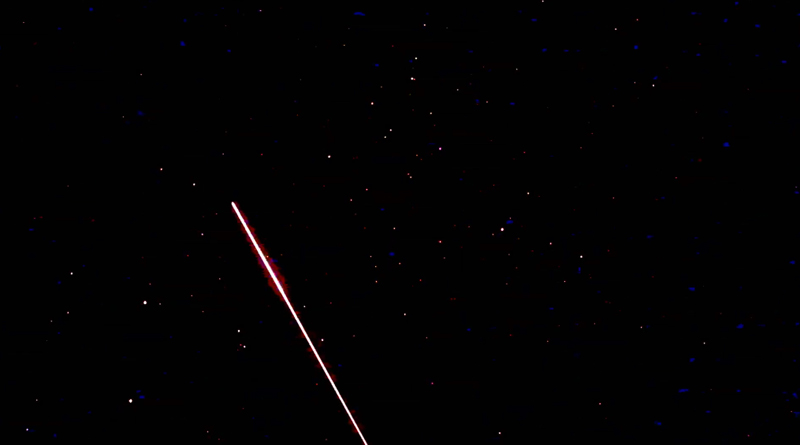
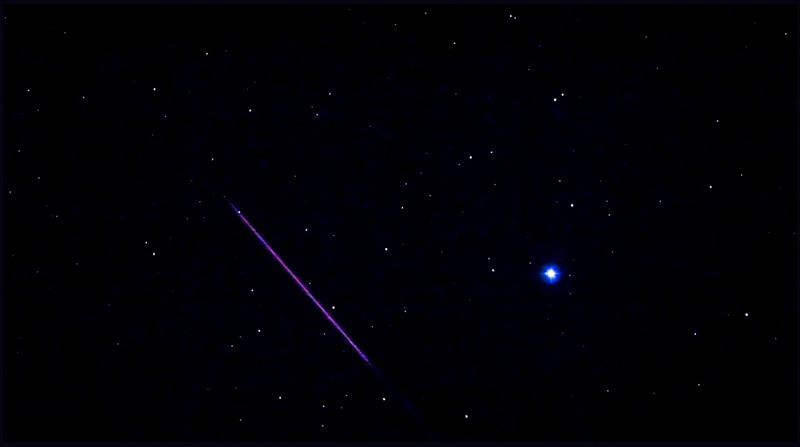
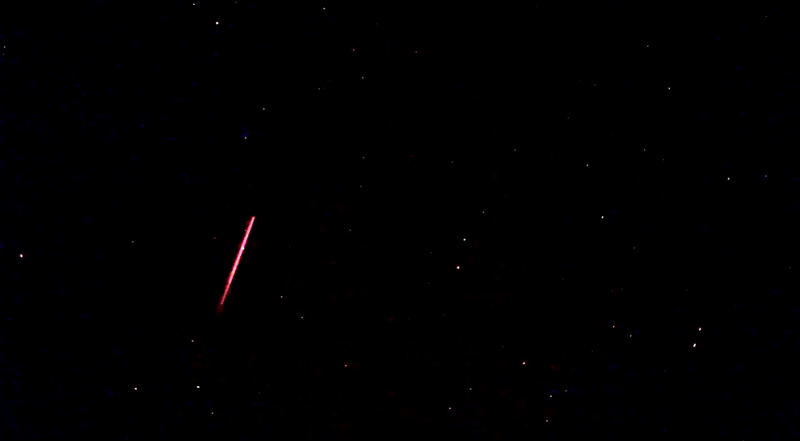
7-18-2018 UFO Red Band of Light 5 Portal WARP FB Hyperstar IR Analysis. Note the starfield within the image frame
is exactly the same as that in the frame, directly above it. That both examples show Red streaks of Light with similar
trajectories. I have some examples which show events with exactness, in time warps. Note in each example is a Red
Streak of Light which differ however; in Length and thickness (radius energy output as seen in these files). 3 events
imaged within a fixed pool of analysis during this session. The frequency says this is not random, nor are the uniform
trajectories.
7-18-2018 UFO Red Band of Light 12 FB Hyperstar IR Analysis. This sample is 100% uniform with Grumman's
4x5" IR 550 image frames documented 8-12-1960 during NASA Project Echo. I needed examples in which the
anomaly was profoundly demonstrated in its abstract abilities to Manifest within our realm. My Hyperhubble
technology was able to document the extraordinary, the way in which this object manifests into our airspace/
realm, was rather specific in that it appears as it disappears.
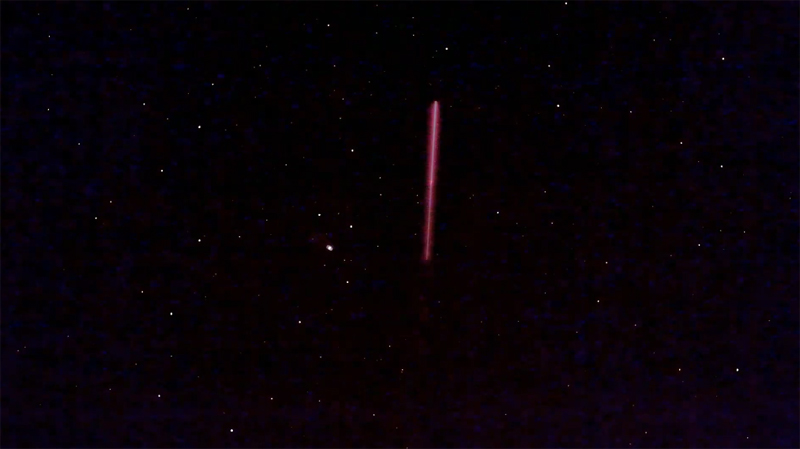
9-19-2018 Red Band of Light 3 Portal Entry Hyperstar 470nm IR Analysis. The sample is rather specific. Clearly we
see this anomaly manifest into the 4K image environment. Understanding the conditions associated with the capture
such as its filmed 60fps and @ 1/200th of a second, we realize that blurring is not relative to the examples presented.
When slowed down significantly, we see based on the 60 frames per second sample, clearly defined activity based on
a High Speed Capture. Secondly this lens application (Hyperstar is 933.3 mm @ f/2.0) is not technically a Telescope,
more so, a Large Iris lens 1000mm (rounded off). However; 1000mm @ f/2.0 with an ISO 4 Million Motion Picture
Imager,is unlike anything on Earth or in Space. However, I needed more than one sample to illustrate the point. This
study is built upon multiple examples.
10-23-2018 UFO Red Band of Light 3 Portal Entry Hyperstar 470nm IR RGBK Analysis. I'll periodically mention that
these examples are all from within one Fixed Pool of Analysis (FPoA).
Again clearly we see this anomaly and its manifestation into our airspace is incremental, as if it passes through a door
from Quantum Space into Normal Space, that in which we exist. Its manner of appearance is always consistent , note
the dates associated with these samples (the one above 10-23-2018) and this one (below) Note, they're both totally
different files. However both show with exactness the same events.
These 2 files, (above and below) are 9 months apart, though they both show the exact same thing
(inclusive of trajectory).
7-14-2019 UFO Red Band of Light 3 Portal Entry Hyperstar 470nm IR RGBKL Analysis
These clearly show these are not acts or randomness. BOth are within a fixed regions of Space as defined by
the Lens parameters. In each example, the actions documented are the same,. though months apart. If not for
the starfield, one would think these are the same files. For the manner in which they appeared stayed relative:
9-16- 2019 UFO Dual Red Band of Lights Portal Entry WARP Flyby Hyperstar 470nm IR RGBKL Analysis. This file
concurs with Grumman 6-28-1960. On one of 2 samples imaged by Grumman, were 2 Band of Light Red Objects.
In 1961 Grumman used IR 550 4 x 5" film which translated as pure red imagery. However here the IR translation
is a 4K 60fps High Speed IR translation.
The strange object was reported as result of a news story in the Argus-Leader saying a vapor trail or what
resembled a large beam of light in the atmosphere was reported over Sioux Falls and later much of the nation.
There is no scientific explanation, as yet for the object, which was reported traveling cast to west rather than
on the west to east trajectory common to man-made satellites.
10-02-2019 UFO Red Band of Light 3 Portal Entry Hyperstar 470nm IR RGBKL Analysis. Note the manner in which
the anomaly appears is always the same, also note the energy field around this specific anomaly. If I see this, and
its 200 miles away, how big is it?
10-15-2019 UFO Sphere Flyby with Red Band of Light Portal Entry Hyperstar 470nm IR RGBKL Analysis In order
to illustrate how this object vanishes I must illustrate its existence in a standard flyby

12-04-2018 UFO Red Band of Light Close Flyby Hyperstar 470nm IR RGBK Line Analysis. This anomaly is recurring
within my Fixed Pool of Analysis .
4-29-2019 UFO Red Band of Light WARP Flyby Hyperstar 470nm IR RGBK Analysis. This sample illustrated the
existence of an energy field around this specific anomaly which also appears as White. However in each example,
the red appears as an extrusion.
Based on the comparatives shown, the anomaly, under normal conditions (on this file), would have been invisible to
humans at the time of the event. 2 optical systems were operating during time of this event, both tubes saw different
things. The IR tube saw Red while the tube filming in the Human bands of light @ 2700K saw relatively nothing
suggesting this would have been totally invisible to humans under the conditions in which its filmed. At times dual
systems are operated with both optical OTA's precisely aligned. I needed more to align the color red energy field
with this anomaly? It came in the form of this spectacular energetic field flyby:
10-19-2019 UFO Red Band of Light Portal Entry Hyperstar 470nm IR RGBKL Analysis
10-28-2019 UFO Red Band of Light 4 Portal Entry Hyperstar 470nm IR RGBKL Analysis. The manner in which it exits,
is as immediate as in the manner in which it appears:
10-04-2018 UFO Red Band of Light Portal Exit Hyperstar 550nm IR Analysis. As we see it, we see what was, from this
point forwards, the anomaly simply disappears, vanishing 100% without a trace. The examples have not deviated from
the target space, the lens is aligned with. All that is seen is seen within the exact field of space, as targeted b a lens
perfectly balanced 90 degrees NSEW.
For the sake of Uniform Consistency, I illustrate the Red Band of Light specific to its outwardly Red Energy component
8-23-2018 UFO Red Band of light Hyperstar IR Analysis
10-23-2018 UFO Red Band of Light 4 WARP FB Hyperstar 470 IR RGBK Analysis
8-03-2019 UFO Red Band of Light WARP Flyby Hyperstar 470 nm IR RGBKL Analysis
10-11-2019 UFO Red Band of Light Flyby Hyperstar 470nm IR RGBKL Analysis. Files essential in establishing the
validity of this anomaly.
12-08-2019 UFO Red Band of Light Portal Entry Hyperstar 470nm IR RGBKL Analysis
12-21-2019 UFO Red Band of Light WARP Flyby Hyperstar 470nm IR RGBKL Tracker Analysis
12-25-2019 UFO Red Band of Light Portal Hyperstar 470nm IR RGBKL Analysis
4-19-2020 UFO Red Band of Light WARP Flyby Hyperstar 470nm IR RGBKL Analysis
![]()
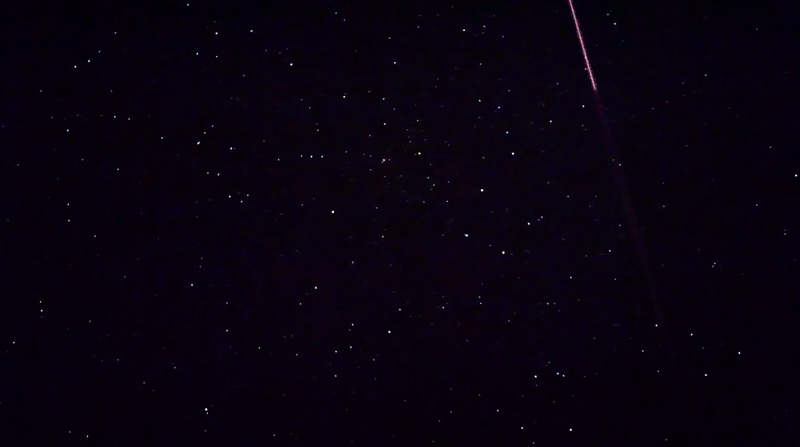
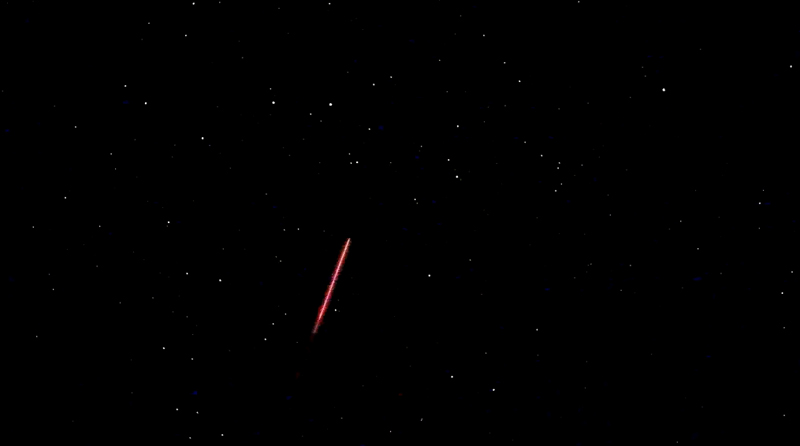
7-15-2020 UFO Red Band of Light Portal Entry Hyperstar 470nm IR RGBCMYK Tracker Analysis
8-05-2020 UFO Red Band of Light WARP Flyby Hyperstar 470nm IR RGBYCML Analysis
![]()
9-13-2020 UFO Red Band of Light FB Hyperstar 470nm IR RGBYCML Tracker Analysis
![]()
![]()

![]()